PNC Bank 2009 Annual Report Download - page 178
Download and view the complete annual report
Please find page 178 of the 2009 PNC Bank annual report below. You can navigate through the pages in the report by either clicking on the pages listed below, or by using the keyword search tool below to find specific information within the annual report.-
 1
1 -
2
-
3
-
4
-
5
-
6
-
7
-
8
-
9
-
10
-
11
-
12
-
13
-
14
-
15
-
16
-
17
-
18
-
19
-
20
-
21
-
22
-
23
-
24
-
25
-
26
-
27
-
28
-
29
-
30
-
31
-
32
-
33
-
34
-
35
-
36
-
37
-
38
-
39
-
40
-
41
-
42
-
43
-
44
-
45
-
46
-
47
-
48
-
49
-
50
-
51
-
52
-
53
-
54
-
55
-
56
-
57
-
58
-
59
-
60
-
61
-
62
-
63
-
64
-
65
-
66
-
67
-
68
-
69
-
70
-
71
-
72
-
73
-
74
-
75
-
76
-
77
-
78
-
79
-
80
-
81
-
82
-
83
-
84
-
85
-
86
-
87
-
88
-
89
-
90
-
91
-
92
-
93
-
94
-
95
-
96
-
97
-
98
-
99
-
100
-
101
-
102
-
103
-
104
-
105
-
106
-
107
-
108
-
109
-
110
-
111
-
112
-
113
-
114
-
115
-
116
-
117
-
118
-
119
-
120
-
121
-
122
-
123
-
124
-
125
-
126
-
127
-
128
-
129
-
130
-
131
-
132
-
133
-
134
-
135
-
136
-
137
-
138
-
139
-
140
-
141
-
142
-
143
-
144
-
145
-
146
-
147
-
148
-
149
-
150
-
151
-
152
-
153
-
154
-
155
-
156
-
157
-
158
-
159
-
160
-
161
-
162
-
163
-
164
-
165
-
166
-
167
-
 168
168 -
 169
169 -
 170
170 -
 171
171 -
 172
172 -
 173
173 -
 174
174 -
 175
175 -
 176
176 -
 177
177 -
 178
178 -
 179
179 -
 180
180 -
 181
181 -
 182
182 -
 183
183 -
 184
184 -
 185
185 -
 186
186 -
 187
187 -
 188
188 -
189
-
190
-
191
-
192
-
193
-
194
-
195
-
196
 |
 |
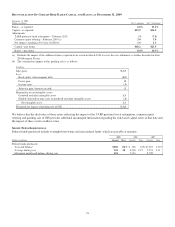
R
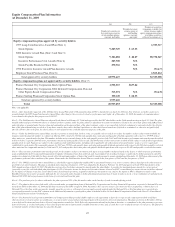
ECONCILIATION
O
F
C
ERTAIN
R
ISK
-B
ASED
C
APITAL AND
R
ATIOS AT
D
ECEMBER
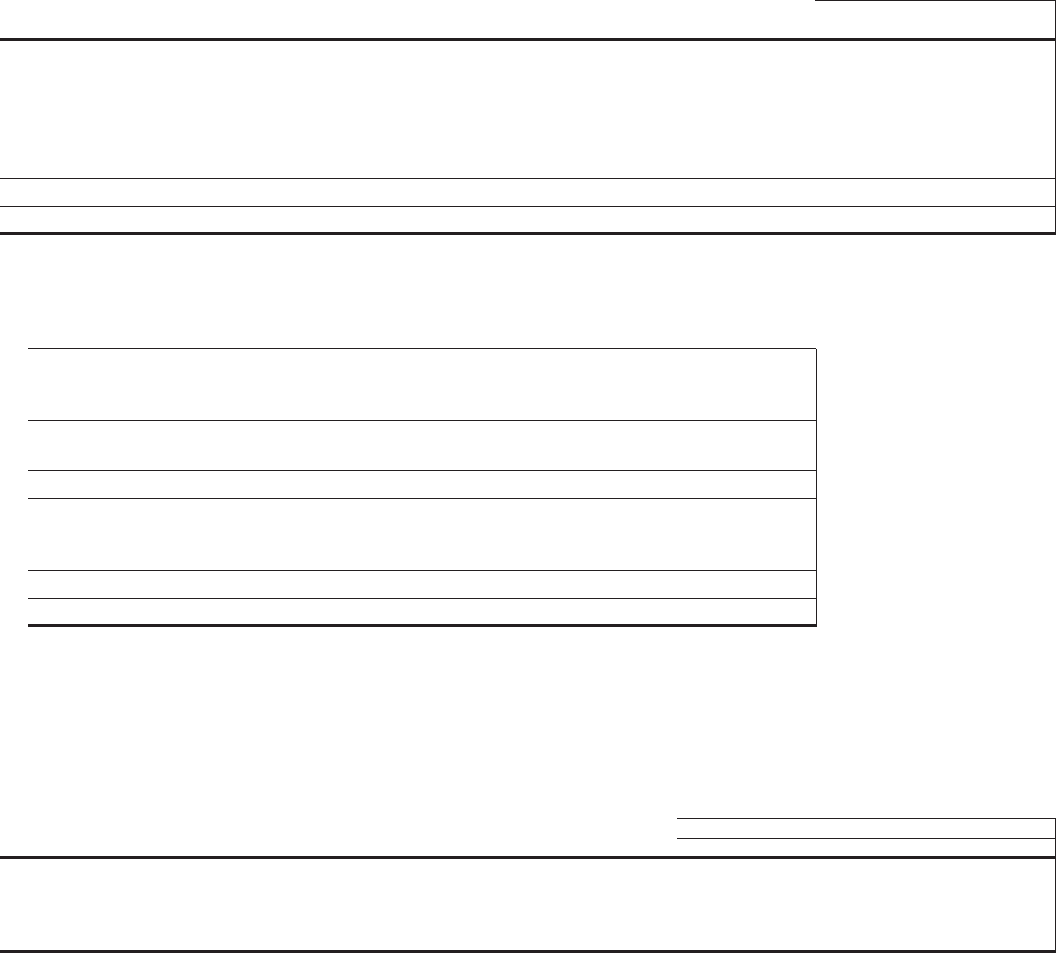
31, 2009
December 31, 2009
Dollars in billions Tier 1 common Tier 1 risk-based
Ratios – as reported 6.0% 11.4%
Capital – as reported $13.9 $26.5
Adjustments:
TARP preferred stock redemption – February 2010 (.3) (7.6)
Common equity offering – February 2010 (a) 3.0 3.0
Net impact of pending 2010 sale of GIS (b) 1.6 1.6
Capital – pro forma $18.2 $23.5
Ratios – pro forma 8.0% 10.3%
(a) Excludes the impact of the additional shares expected to be issued in March 2010 to cover the over-allotments as further described in Note
28 Subsequent Events.
(b) The estimated net impact of this pending sale is as follows:
In billions
Sales price $ 2.3
Less:
Book equity / intercompany debt (1.5)
Pretax gain .8
Income taxes (.3)
After-tax gain / increase in cash .5
Elimination of net intangible assets:
Goodwill and other intangible assets 1.3
Eligible deferred income taxes on goodwill and other intangible assets (.2)
Net intangible assets 1.1
Estimated net impact of pending sale of GIS $ 1.6
We believe that the disclosure of these ratios reflecting the impact of the TARP preferred stock redemption, common equity
offering and pending sale of GIS provides additional meaningful information regarding the risk-based capital ratios at that date and
the impact of these events on these ratios.
S
HORT
-T
ERM
B
ORROWINGS
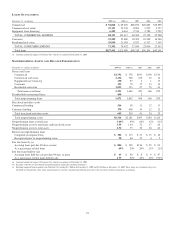
Federal funds purchased include overnight borrowings and term federal funds, which are payable at maturity.
2009 2008 2007
Dollars in millions Amount Rate Amount Rate Amount Rate
Federal funds purchased
Year-end balance $182 .06% $ 128 .01% $7,037 3.17%
Average during year 324 .18 4,518 2.15 5,533 5.13
Maximum month-end balance during year 421 7,343 8,798
174