PNC Bank 2009 Annual Report Download - page 29
Download and view the complete annual report
Please find page 29 of the 2009 PNC Bank annual report below. You can navigate through the pages in the report by either clicking on the pages listed below, or by using the keyword search tool below to find specific information within the annual report.-
 1
1 -
2
-
3
-
4
-
5
-
6
-
7
-
8
-
9
-
10
-
11
-
12
-
13
-
14
-
15
-
16
-
17
-
18
-
 19
19 -
 20
20 -
 21
21 -
 22
22 -
 23
23 -
 24
24 -
 25
25 -
 26
26 -
 27
27 -
 28
28 -
 29
29 -
 30
30 -
 31
31 -
 32
32 -
 33
33 -
 34
34 -
 35
35 -
 36
36 -
 37
37 -
 38
38 -
 39
39 -
40
-
41
-
42
-
43
-
44
-
45
-
46
-
47
-
48
-
49
-
50
-
51
-
52
-
53
-
54
-
55
-
56
-
57
-
58
-
59
-
60
-
61
-
62
-
63
-
64
-
65
-
66
-
67
-
68
-
69
-
70
-
71
-
72
-
73
-
74
-
75
-
76
-
77
-
78
-
79
-
80
-
81
-
82
-
83
-
84
-
85
-
86
-
87
-
88
-
89
-
90
-
91
-
92
-
93
-
94
-
95
-
96
-
97
-
98
-
99
-
100
-
101
-
102
-
103
-
104
-
105
-
106
-
107
-
108
-
109
-
110
-
111
-
112
-
113
-
114
-
115
-
116
-
117
-
118
-
119
-
120
-
121
-
122
-
123
-
124
-
125
-
126
-
127
-
128
-
129
-
130
-
131
-
132
-
133
-
134
-
135
-
136
-
137
-
138
-
139
-
140
-
141
-
142
-
143
-
144
-
145
-
146
-
147
-
148
-
149
-
150
-
151
-
152
-
153
-
154
-
155
-
156
-
157
-
158
-
159
-
160
-
161
-
162
-
163
-
164
-
165
-
166
-
167
-
168
-
169
-
170
-
171
-
172
-
173
-
174
-
175
-
176
-
177
-
178
-
179
-
180
-
181
-
182
-
183
-
184
-
185
-
186
-
187
-
188
-
189
-
190
-
191
-
192
-
193
-
194
-
195
-
196
 |
 |

• Revenue growth,
• A sustained focus on expense management, including
achieving our cost savings targets associated with our
National City integration, and creating positive
pre-tax, pre-provision earnings,
• Managing the distressed assets portfolio and other
impaired assets,
• Maintaining our overall asset quality and continuing
to meet evolving regulatory capital standards,
• Continuing to maintain and grow our deposit base as
a low-cost funding source,
• Prudent risk and capital management leading to a
return to our desired moderate risk profile, and
• Actions we take within the capital and other financial
markets.
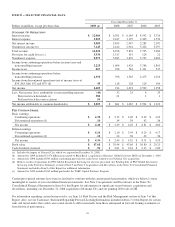
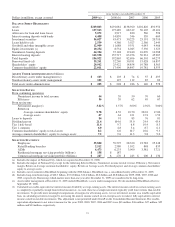
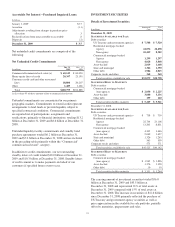
Summary Financial Results Year ended December 31
2009 2008
Net income, in millions $2,403 $ 914
Diluted earnings per common share
Continuing operations $ 4.26 $2.10
Discontinued operations .10 .34
Net income $ 4.36 $2.44
Return on
Average common shareholders’ equity 9.78% 6.52%
Average assets .87% .64%
On December 1, 2009, BlackRock acquired Barclays Global
Investors (BGI) from Barclays Bank PLC. PNC recognized a
pretax gain of $1.076 billion, or $687 million after taxes, in
the fourth quarter of 2009 related to this transaction.
Additional information regarding this transaction is included
within the BlackRock section of our Business Segments
Review section of this Item 7.
Our earnings and related per share amounts for 2008 do not
include the impact of National City, which we acquired
effective December 31, 2008, other than a conforming
adjustment to our provision for credit losses of $504 million
and other integration costs of $71 million, both of which were
recognized in the fourth quarter of 2008. Our Consolidated
Balance Sheet at December 31, 2008 includes National City’s
assets and liabilities at estimated fair value.
Our performance in 2009 included the following:
• We remain committed to responsible lending to
support economic growth. Loans and commitments
originated and renewed totaled approximately $110
billion in 2009. Included were $4 billion of small
business loans originated and renewed in 2009, and
we have enhanced our second-look programs for
small business loan applications. As of December 31,
2009, we had funded approximately 2,100 refinances
totaling $.4 billion through the Home Affordable
Refinance Program and over 70,000 solicitations
under the Home Affordable Modification Program
had been sent to eligible borrowers.
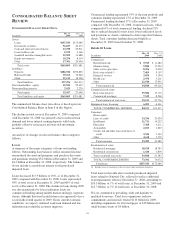
• Loans totaled $158 billion at December 31, 2009 and
declined 2% during the fourth quarter reflecting a
slower pace of decline compared with the first nine
months of 2009.
• We effectively managed deposit pricing and
realigned the deposit mix during 2009, growing
transaction deposits by $15 billion, or 14%, and
reducing nonrelationship certificates of deposit by
approximately $16 billion.
• Pretax, pre-provision earnings of $7.2 billion exceeded
the provision for credit losses by $3.2 billion for 2009.
• Total revenue was $16.2 billion for 2009, reflecting
our diverse revenue sources. The net interest margin
increased 45 basis points to 3.82% in 2009 compared
with 2008.
• Noninterest expense totaled $9.1 billion in 2009,
including $421 million of integration costs offset by
$800 million of acquisition cost savings.
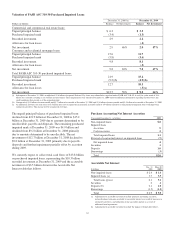
• The pace of credit quality deterioration continued to
ease during the fourth quarter of 2009.
Nonperforming assets increased $.7 billion over the
third quarter to $6.3 billion, a lower increase
compared with the $1.0 billion increase in the third
quarter. We strengthened loan loss reserves for the
11th consecutive quarter. The allowance for loan and
lease losses of $5.1 billion combined with $4.9
billion of marks on acquired impaired loans
represented approximately 6% of loans outstanding at
December 31, 2009.
• Capital ratios continued to grow. The Tier 1 common
equity ratio increased by 50 basis points to 6.0% at
December 31, 2009 and the Tier 1 risk-based capital
ratio increased by 50 basis points to 11.4% as of
year-end.
• We continued to maintain a strong bank liquidity
position with an 84% loan to deposit ratio at
December 31, 2009. Holding company liquidity
remained strong with sufficient liquid assets to fund
2010 debt maturities and other corporate obligations.
• The acquisition of National City Corporation
exceeded our expectations during 2009.
- The transaction was accretive to 2009 earnings.
- Cost savings of over $800 million were
realized in 2009. We increased our multi-year
acquisition-related annualized cost savings goal
to $1.5 billion from $1.2 billion and are on
track to meet the new goal.
- We have successfully completed two major
conversions of National City customers to the
PNC platform – one in November 2009 and
another in February 2010. We expect to
complete the two remaining conversions by
June 2010, ahead of original plans.
- We completed the consolidation of bank
charters in November 2009.
25