PNC Bank 2009 Annual Report Download - page 159
Download and view the complete annual report
Please find page 159 of the 2009 PNC Bank annual report below. You can navigate through the pages in the report by either clicking on the pages listed below, or by using the keyword search tool below to find specific information within the annual report.-
 1
1 -
2
-
3
-
4
-
5
-
6
-
7
-
8
-
9
-
10
-
11
-
12
-
13
-
14
-
15
-
16
-
17
-
18
-
19
-
20
-
21
-
22
-
23
-
24
-
25
-
26
-
27
-
28
-
29
-
30
-
31
-
32
-
33
-
34
-
35
-
36
-
37
-
38
-
39
-
40
-
41
-
42
-
43
-
44
-
45
-
46
-
47
-
48
-
49
-
50
-
51
-
52
-
53
-
54
-
55
-
56
-
57
-
58
-
59
-
60
-
61
-
62
-
63
-
64
-
65
-
66
-
67
-
68
-
69
-
70
-
71
-
72
-
73
-
74
-
75
-
76
-
77
-
78
-
79
-
80
-
81
-
82
-
83
-
84
-
85
-
86
-
87
-
88
-
89
-
90
-
91
-
92
-
93
-
94
-
95
-
96
-
97
-
98
-
99
-
100
-
101
-
102
-
103
-
104
-
105
-
106
-
107
-
108
-
109
-
110
-
111
-
112
-
113
-
114
-
115
-
116
-
117
-
118
-
119
-
120
-
121
-
122
-
123
-
124
-
125
-
126
-
127
-
128
-
129
-
130
-
131
-
132
-
133
-
134
-
135
-
136
-
137
-
138
-
139
-
140
-
141
-
142
-
143
-
144
-
145
-
146
-
147
-
148
-
 149
149 -
 150
150 -
 151
151 -
 152
152 -
 153
153 -
 154
154 -
 155
155 -
 156
156 -
 157
157 -
 158
158 -
 159
159 -
 160
160 -
 161
161 -
 162
162 -
 163
163 -
 164
164 -
 165
165 -
 166
166 -
 167
167 -
 168
168 -
 169
169 -
170
-
171
-
172
-
173
-
174
-
175
-
176
-
177
-
178
-
179
-
180
-
181
-
182
-
183
-
184
-
185
-
186
-
187
-
188
-
189
-
190
-
191
-
192
-
193
-
194
-
195
-
196
 |
 |

N
OTE
22 S
UMMARIZED
F
INANCIAL
I
NFORMATION OF
B
LACK
R
OCK
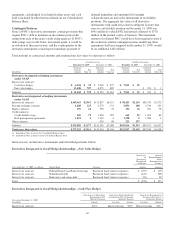
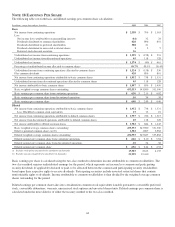
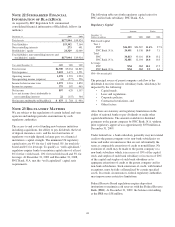
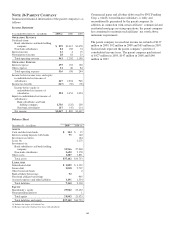
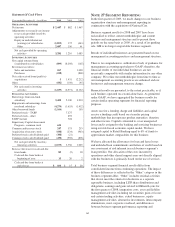
As required by SEC Regulation S-X, summarized
consolidated financial information of BlackRock follows (in
millions).
December 31 2009 2008
Total assets $177,994 $19,924
Total liabilities 153,392 7,364
Non-controlling interests 273 491
Stockholders’ equity 24,329 12,069
Total liabilities, non-controlling interests and
stockholders’ equity $177,994 $19,924
Year ended December 31 2009 2008 2007
Total revenue $4,700 $5,064 $4,845
Total expenses 3,422 3,471 3,551
Operating income 1,278 1,593 1,294
Non-operating income (expense) (6) (577) 526
Income before income taxes 1,272 1,016 1,820
Income tax expense 375 387 463
Net income 897 629 1,357
Less: net income (loss) attributable to
non-controlling interests 22 (155) 364
Net income attributable to BlackRock $ 875 $ 784 $ 993
N
OTE
23 R
EGULATORY
M
ATTERS
We are subject to the regulations of certain federal and state
agencies and undergo periodic examinations by such
regulatory authorities.
The access to and cost of funding new business initiatives
including acquisitions, the ability to pay dividends, the level
of deposit insurance costs, and the level and nature of
regulatory oversight depend, in large part, on a financial
institution’s capital strength. The minimum US regulatory
capital ratios are 4% for tier 1 risk-based, 8% for total risk-
based and 4% for leverage. To qualify as “well capitalized,”
regulators require banks to maintain capital ratios of at least
6% for tier 1 risk-based, 10% for total risk-based and 5% for
leverage. At December 31, 2009 and December 31, 2008,
PNC Bank, N.A. met the “well capitalized” capital ratio
requirements.
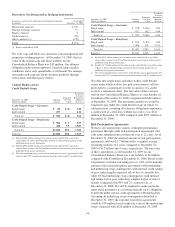
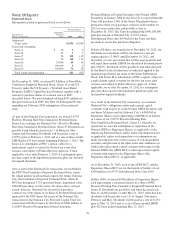
The following table sets forth regulatory capital ratios for
PNC and its bank subsidiary, PNC Bank, N.A.
Regulatory Capital
Amount Ratios
December 31
Dollars in millions 2009 2008 2009 2008
Risk-based capital
Tier 1
PNC $26,523 $24,287 11.4% 9.7%
PNC Bank, N.A. 24,491 8,338 10.9 7.1
Total
PNC 34,813 33,116 15.0 13.2
PNC Bank, N.A. 32,481 12,104 14.4 10.3
Leverage
PNC NM NM 10.1 17.5
PNC Bank, N.A. NM NM 9.3 6.3
NM—Not meaningful.
The principal source of parent company cash flow is the
dividends it receives from its subsidiary bank, which may be
impacted by the following:
• Capital needs,
• Laws and regulations,
• Corporate policies,
• Contractual restrictions, and
• Other factors.
Also, there are statutory and regulatory limitations on the
ability of national banks to pay dividends or make other
capital distributions. The amount available for dividend
payments to the parent company by PNC Bank, N.A. without
prior regulatory approval was approximately $378 million at
December 31, 2009.
Under federal law, a bank subsidiary generally may not extend
credit to the parent company or its non-bank subsidiaries on
terms and under circumstances that are not substantially the
same as comparable extensions of credit to nonaffiliates. No
extension of credit may be made to the parent company or a
non-bank subsidiary which is in excess of 10% of the capital
stock and surplus of such bank subsidiary or in excess of 20%
of the capital and surplus of such bank subsidiary as to
aggregate extensions of credit to the parent company and its
non-bank subsidiaries. Such extensions of credit, with limited
exceptions, must be fully collateralized by certain specified
assets. In certain circumstances, federal regulatory authorities
may impose more restrictive limitations.
Federal Reserve Board regulations require depository
institutions to maintain cash reserves with the Federal Reserve
Bank (FRB). At December 31, 2009, the balance outstanding
at the FRB was $38 million.
155