PNC Bank 2009 Annual Report Download - page 57
Download and view the complete annual report
Please find page 57 of the 2009 PNC Bank annual report below. You can navigate through the pages in the report by either clicking on the pages listed below, or by using the keyword search tool below to find specific information within the annual report.-
 1
1 -
2
-
3
-
4
-
5
-
6
-
7
-
8
-
9
-
10
-
11
-
12
-
13
-
14
-
15
-
16
-
17
-
18
-
19
-
20
-
21
-
22
-
23
-
24
-
25
-
26
-
27
-
28
-
29
-
30
-
31
-
32
-
33
-
34
-
35
-
36
-
37
-
38
-
39
-
40
-
41
-
42
-
43
-
44
-
45
-
46
-
 47
47 -
 48
48 -
 49
49 -
 50
50 -
 51
51 -
 52
52 -
 53
53 -
 54
54 -
 55
55 -
 56
56 -
 57
57 -
 58
58 -
 59
59 -
 60
60 -
 61
61 -
 62
62 -
 63
63 -
 64
64 -
 65
65 -
 66
66 -
 67
67 -
68
-
69
-
70
-
71
-
72
-
73
-
74
-
75
-
76
-
77
-
78
-
79
-
80
-
81
-
82
-
83
-
84
-
85
-
86
-
87
-
88
-
89
-
90
-
91
-
92
-
93
-
94
-
95
-
96
-
97
-
98
-
99
-
100
-
101
-
102
-
103
-
104
-
105
-
106
-
107
-
108
-
109
-
110
-
111
-
112
-
113
-
114
-
115
-
116
-
117
-
118
-
119
-
120
-
121
-
122
-
123
-
124
-
125
-
126
-
127
-
128
-
129
-
130
-
131
-
132
-
133
-
134
-
135
-
136
-
137
-
138
-
139
-
140
-
141
-
142
-
143
-
144
-
145
-
146
-
147
-
148
-
149
-
150
-
151
-
152
-
153
-
154
-
155
-
156
-
157
-
158
-
159
-
160
-
161
-
162
-
163
-
164
-
165
-
166
-
167
-
168
-
169
-
170
-
171
-
172
-
173
-
174
-
175
-
176
-
177
-
178
-
179
-
180
-
181
-
182
-
183
-
184
-
185
-
186
-
187
-
188
-
189
-
190
-
191
-
192
-
193
-
194
-
195
-
196
 |
 |

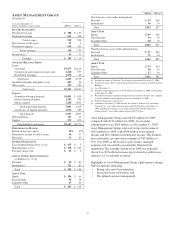
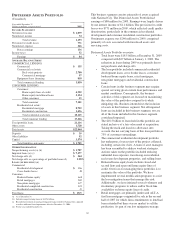
C
ORPORATE
&I
NSTITUTIONAL
B
ANKING
(Unaudited)
Year ended December 31
Dollars in millions except as noted 2009 (a) 2008
I
NCOME
S
TATEMENT
Net interest income $ 3,833 $ 1,323
Noninterest income
Corporate service fees 915 583
Other 518 (47)
Noninterest income 1,433 536
Total revenue 5,266 1,859
Provision for credit losses 1,603 575
Noninterest expense 1,800 945
Pretax earnings 1,863 339
Income taxes 673 124
Earnings $ 1,190 $ 215
A
VERAGE
B
ALANCE
S
HEET
Loans
Commercial $41,132 $20,439
Commercial real estate 15,489 5,584
Commercial – real estate related 3,772 3,049
Asset-based lending 6,344 5,274
Equipment lease financing 5,390 1,482
Total loans 72,127 35,828
Goodwill and other intangible assets 3,583 3,149
Loans held for sale 1,679 2,053
Other assets 7,300 6,020
Total assets $84,689 $47,050
Deposits
Noninterest-bearing demand $19,948 $ 8,388
Money market 9,697 5,817
Other 7,911 3,129
Total deposits 37,556 17,334
Other liabilities 9,118 5,357
Capital 7,837 3,087
Total liabilities and equity $54,511 $25,778
P
ERFORMANCE
R
ATIOS
Return on average capital 15% 7%
Noninterest income to total revenue 27 29
Efficiency 34 51
C
OMMERCIAL
M
ORTGAGE
S
ERVICING
P
ORTFOLIO
(in billions)
Beginning of period $ 270 $ 243
Acquisitions/additions 50 51
Repayments/transfers (33) (24)
End of period $ 287 $ 270
O
THER
I
NFORMATION
Consolidated revenue from: (b)
Treasury Management $ 1,137 $ 567
Capital Markets $ 533 $ 336
Commercial mortgage loans held for sale (c) $ 205 $ (115)
Commercial mortgage loan servicing (d) 280 180
Total commercial mortgage banking
activities $ 485 $65
Total loans (e) $66,206 $38,063
Credit-related statistics:
Nonperforming assets (e) (f) $ 3,167 $ 1,173
Impaired loans (e) (g) $ 1,075 $ 1,816
Net charge-offs $ 1,052 $ 267
Net carrying amount of commercial
mortgage servicing rights (e) $ 921 $ 654
(a) Includes the impact of National City, which we acquired on December 31, 2008.
(b) Represents consolidated PNC amounts.
(c) Includes valuations on commercial mortgage loans held for sale and related
commitments, derivative valuations, origination fees, gains on sale of loans and net
interest income on loans held for sale.
(d) Includes net interest income and noninterest income from loan servicing and
ancillary services.
(e) At December 31.
(f) Includes nonperforming loans of $3.0 billion at December 31, 2009 and $1.2 billion
at December 31, 2008.
(g) Recorded investment of purchased impaired loans related to National City, adjusted
to reflect additional loan impairments effective December 31, 2008.
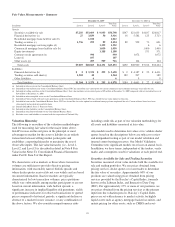
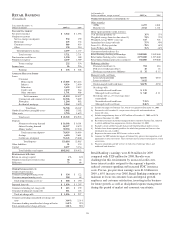
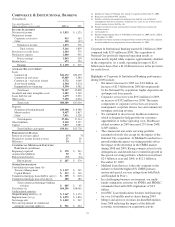
Corporate & Institutional Banking earned $1.2 billion in 2009
compared with $215 million in 2008. The acquisition of
National City positively impacted operating results as
revenues nearly tripled while expenses approximately doubled
in the comparison. As a result, operating leverage of $2.6
billion more than offset a $1.0 billion increase in the provision
for credit losses.
Highlights of Corporate & Institutional Banking performance
during 2009 include:
• Net interest income for 2009 was $3.8 billion, an
increase of $2.5 billion from 2008 driven primarily
by the National City acquisition, higher deposit levels
and improved loan spreads.
• Corporate service fees were $915 million for 2009,
an increase of $332 million over 2008. The major
components of corporate service fees are treasury
management, corporate finance fees and commercial
mortgage servicing revenue.
• We continued to invest in our healthcare initiative
which is designed to help provide our customers
opportunities to reduce operating costs. Healthcare-
related revenues in 2009 increased 23% from 2008,
to $85 million.
• The commercial real estate servicing portfolio
remained relatively flat except for the impact of the
National City acquisition. At Midland Loan Services,
growth within the agency servicing portfolio offset
the impact of the downturn in the CMBS market
during 2008 and 2009. Rising commercial real estate
delinquencies and defaults have resulted in growth in
the special servicing portfolio, which increased from
$2.9 billion at year-end 2008, to $12.1 billion at
December 31, 2009.
• Midland Loan Services is the only company in the
industry to hold the highest US CMBS primary,
master and special servicer ratings from both Fitch
and Standard & Poor’s.
• In a challenging business environment, our multi-
family origination activities for FNMA and FHMLC
remained robust with 2009 originations of $4.2
billion.
• Our PNC Loan Syndications business led financings
for over 160 middle market clients during 2009.
• Merger and advisory revenues declined $68 million
from 2008 reflecting the impact of the difficult
economic environment on acquisition activity.
53