PNC Bank 2009 Annual Report Download - page 73
Download and view the complete annual report
Please find page 73 of the 2009 PNC Bank annual report below. You can navigate through the pages in the report by either clicking on the pages listed below, or by using the keyword search tool below to find specific information within the annual report.-
 1
1 -
2
-
3
-
4
-
5
-
6
-
7
-
8
-
9
-
10
-
11
-
12
-
13
-
14
-
15
-
16
-
17
-
18
-
19
-
20
-
21
-
22
-
23
-
24
-
25
-
26
-
27
-
28
-
29
-
30
-
31
-
32
-
33
-
34
-
35
-
36
-
37
-
38
-
39
-
40
-
41
-
42
-
43
-
44
-
45
-
46
-
47
-
48
-
49
-
50
-
51
-
52
-
53
-
54
-
55
-
56
-
57
-
58
-
59
-
60
-
61
-
62
-
 63
63 -
 64
64 -
 65
65 -
 66
66 -
 67
67 -
 68
68 -
 69
69 -
 70
70 -
 71
71 -
 72
72 -
 73
73 -
 74
74 -
 75
75 -
 76
76 -
 77
77 -
 78
78 -
 79
79 -
 80
80 -
 81
81 -
 82
82 -
 83
83 -
84
-
85
-
86
-
87
-
88
-
89
-
90
-
91
-
92
-
93
-
94
-
95
-
96
-
97
-
98
-
99
-
100
-
101
-
102
-
103
-
104
-
105
-
106
-
107
-
108
-
109
-
110
-
111
-
112
-
113
-
114
-
115
-
116
-
117
-
118
-
119
-
120
-
121
-
122
-
123
-
124
-
125
-
126
-
127
-
128
-
129
-
130
-
131
-
132
-
133
-
134
-
135
-
136
-
137
-
138
-
139
-
140
-
141
-
142
-
143
-
144
-
145
-
146
-
147
-
148
-
149
-
150
-
151
-
152
-
153
-
154
-
155
-
156
-
157
-
158
-
159
-
160
-
161
-
162
-
163
-
164
-
165
-
166
-
167
-
168
-
169
-
170
-
171
-
172
-
173
-
174
-
175
-
176
-
177
-
178
-
179
-
180
-
181
-
182
-
183
-
184
-
185
-
186
-
187
-
188
-
189
-
190
-
191
-
192
-
193
-
194
-
195
-
196
 |
 |

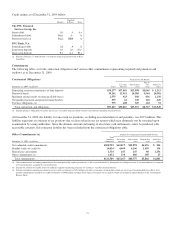
Although the allowance declined as a percentage of
nonperforming loans at December 31, 2009 as compared with
December 31, 2008, coverage is considered adequate given
the mix of the loan portfolio. The majority of the commercial
portfolio is secured by collateral, including loans to asset-
based lending customers that continue to show demonstrably
lower loss given default. Further, the large high investment
grade portion of the loan portfolio has performed well and has
not been subject to significant deterioration.
The allowance for loan and lease losses is significantly lower
than it would have been otherwise due to the accounting
treatment for purchased impaired loans. This treatment also
results in a lower ratio of allowance for loan and lease losses
to total loans. Loan loss reserves on the purchased impaired
loans were not carried over on the date of acquisition. In
addition, these loans were recorded net of $9.2 billion of fair
value marks as of December 31, 2008. As a result, the ratio of
allowance for loan and lease losses to total loans is lower than
it would be otherwise.
In addition to the allowance for loan and lease losses, we
maintain an allowance for unfunded loan commitments and
letters of credit. We report this allowance as a liability on our
Consolidated Balance Sheet. We determine this amount using
estimates of the probability of the ultimate funding and losses
related to those credit exposures. This methodology is similar
to the one we use for determining the adequacy of our
allowance for loan and lease losses.
We refer you to Note 5 Asset Quality and Note 6 Purchased
Impaired Loans Related to National City in the Notes To
Consolidated Financial Statements in Item 8 of this Report
regarding changes in the allowance for loan and lease losses
and in the allowance for unfunded loan commitments and
letters of credit. Also see the Allocation Of Allowance For
Loan And Lease Losses table in the Statistical Information
(Unaudited) section of Item 8 of this Report for additional
information included herein by reference.
We establish specific allowances for loans considered
impaired using a method prescribed by GAAP. All impaired
loans except leases and large groups of smaller-balance
homogeneous loans which may include but are not limited to
credit card, residential mortgage, and consumer installment
loans are subject to individual analysis. Specific allowances
for individual loans are determined by our Special Asset
Committee based on an analysis of the present value of
expected future cash flows from the loans discounted at their
effective interest rate, observable market price, or the fair
value of the underlying collateral.
Allocations to commercial and commercial real estate loans
(pool reserve methodology) are assigned to pools of loans as
defined by our business structure and are based on internal
probability of default and loss given default credit risk ratings.
Key elements of the pool reserve methodology include:
• Probability of default (PD), which is primarily based
on historical default analyses and is derived from the
borrower’s internal PD credit risk rating;
• Exposure at default (EAD), which is derived from
historical default data; and
• Loss given default (LGD), which is based on
historical loss data, collateral value and other
structural factors that may affect our ultimate ability
to collect on the loan and is derived from the loan’s
internal LGD credit risk rating.
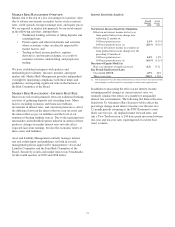
Our pool reserve methodology is sensitive to changes in key
risk parameters such as PDs, LGDs and EADs. In general, a
given change in any of the major risk parameters will have a
corresponding change in the pool reserve allocations for
non-impaired commercial loans. Our commercial loans are the
largest category of credits and are most sensitive to changes in
the key risk parameters and pool reserve loss rates. To
illustrate, if we increase the pool reserve loss rates by 5% for
all categories of non-impaired commercial loans, then the
aggregate of the allowance for loan and lease losses and
allowance for unfunded loan commitments and letters of
credit would increase by $104 million. Additionally, other
factors such as the rate of migration in the severity of problem
loans will contribute to the final pool reserve allocations.
We make consumer (including residential mortgage) loan
reserve allocations within our business structure by consumer
product line based on historical loss experience. We compute
the allocation loss rates using the roll-rate, historical loss or
other appropriate loss calculation methodologies.
We expect to see credit cost improvements in line with the
pace of economic recovery in 2010.
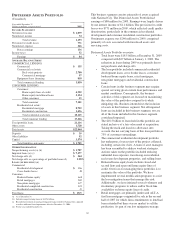
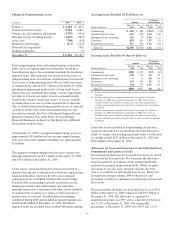
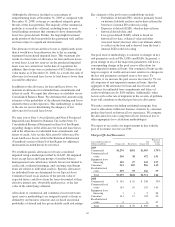
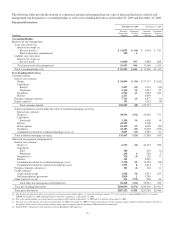
Charge-Offs And Recoveries
Year ended December 31
Dollars in millions Charge-offs Recoveries
Net
Charge-offs
Percent of
Average
Loans
2009
Commercial $1,276 $181 $1,095 1.79%
Commercial real
estate 510 38 472 1.91
Equipment lease
financing 149 27 122 1.97
Consumer 961 105 856 1.63
Residential real
estate 259 93 166 .79
Total $3,155 $444 $2,711 1.64
2008
Commercial $ 301 $ 53 $ 248 .79%
Commercial real
estate 165 10 155 1.65
Equipment lease
financing 3 1 2 .08
Consumer 143 15 128 .62
Residential real
estate 6 6 .07
Total $ 618 $ 79 $ 539 .74
69