PNC Bank 2009 Annual Report Download - page 136
Download and view the complete annual report
Please find page 136 of the 2009 PNC Bank annual report below. You can navigate through the pages in the report by either clicking on the pages listed below, or by using the keyword search tool below to find specific information within the annual report.-
 1
1 -
2
-
3
-
4
-
5
-
6
-
7
-
8
-
9
-
10
-
11
-
12
-
13
-
14
-
15
-
16
-
17
-
18
-
19
-
20
-
21
-
22
-
23
-
24
-
25
-
26
-
27
-
28
-
29
-
30
-
31
-
32
-
33
-
34
-
35
-
36
-
37
-
38
-
39
-
40
-
41
-
42
-
43
-
44
-
45
-
46
-
47
-
48
-
49
-
50
-
51
-
52
-
53
-
54
-
55
-
56
-
57
-
58
-
59
-
60
-
61
-
62
-
63
-
64
-
65
-
66
-
67
-
68
-
69
-
70
-
71
-
72
-
73
-
74
-
75
-
76
-
77
-
78
-
79
-
80
-
81
-
82
-
83
-
84
-
85
-
86
-
87
-
88
-
89
-
90
-
91
-
92
-
93
-
94
-
95
-
96
-
97
-
98
-
99
-
100
-
101
-
102
-
103
-
104
-
105
-
106
-
107
-
108
-
109
-
110
-
111
-
112
-
113
-
114
-
115
-
116
-
117
-
118
-
119
-
120
-
121
-
122
-
123
-
124
-
125
-
 126
126 -
 127
127 -
 128
128 -
 129
129 -
 130
130 -
 131
131 -
 132
132 -
 133
133 -
 134
134 -
 135
135 -
 136
136 -
 137
137 -
 138
138 -
 139
139 -
 140
140 -
 141
141 -
 142
142 -
 143
143 -
 144
144 -
 145
145 -
 146
146 -
147
-
148
-
149
-
150
-
151
-
152
-
153
-
154
-
155
-
156
-
157
-
158
-
159
-
160
-
161
-
162
-
163
-
164
-
165
-
166
-
167
-
168
-
169
-
170
-
171
-
172
-
173
-
174
-
175
-
176
-
177
-
178
-
179
-
180
-
181
-
182
-
183
-
184
-
185
-
186
-
187
-
188
-
189
-
190
-
191
-
192
-
193
-
194
-
195
-
196
 |
 |

N
OTE
11 P
REMISES
,E
QUIPMENT AND
L
EASEHOLD
I
MPROVEMENTS
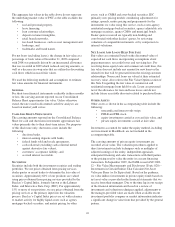
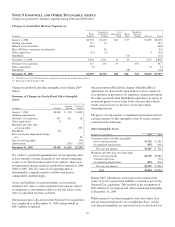
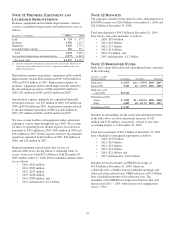
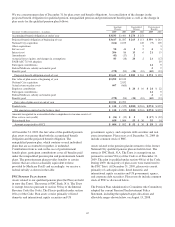
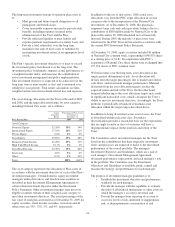
Premises, equipment and leasehold improvements, stated at
cost less accumulated depreciation and amortization, were as
follows:
December 31 - in millions 2009 (a) 2008
Land $ 733 $ 577
Buildings 1,692 1,215
Equipment 3,423 2,773
Leasehold improvements 626 531
Total 6,474 5,096
Accumulated depreciation and amortization (2,277) (1,867)
Net book value $ 4,197 $ 3,229
(a) Includes adjustments of the purchase price allocation related to the National City
acquisition totaling $891 million. See Note 2 Acquisitions and Divestitures for
additional information.
Depreciation expense on premises, equipment and leasehold
improvements totaled $466 million in 2009, $194 million in
2008 and $154 million in 2007. Depreciation expense on
premises, equipment and leasehold improvements related to
the discontinued operations of GIS totaled $29 million in
2009, $31 million in 2008, and $24 million in 2007.
Amortization expense, primarily for capitalized internally
developed software, was $79 million in 2009, $19 million in
2008 and $18 million in 2007. Amortization expense related
to the discontinued operations of GIS was $26 million in
2009, $25 million in 2008, and $22 million in 2007.
We lease certain facilities and equipment under agreements
expiring at various dates through the year 2067. We account
for these as operating leases. Rental expense on such leases
amounted to $372 million in 2009, $184 million in 2008 and
$194 million in 2007. Rental expense related to discontinued
operations amounted to $16 million in 2009, $18 million in
2008, and $13 million in 2007.
Required minimum annual rentals that we owe on
noncancelable leases having initial or remaining terms in
excess of one year totaled $2.6 billion at both December 31,
2009 and December 31, 2008. Future minimum annual rentals
are as follows:
• 2010: $423 million,
• 2011: $303 million,
• 2012: $257 million,
• 2013: $236 million,
• 2014: $200 million, and
• 2015 and thereafter: $1.2 billion.
N
OTE
12 D
EPOSITS
The aggregate amount of time deposits with a denomination of
$100,000 or more was $20.4 billion at December 31, 2009 and
$26.8 billion at December 31, 2008.
Total time deposits of $54.3 billion at December 31, 2009
have future contractual maturities as follows:
• 2010: $37.0 billion,
• 2011: $6.3 billion,
• 2012: $7.7 billion,
• 2013: $1.4 billion,
• 2014: $.7 billion, and
• 2015 and thereafter: $1.2 billion.
N
OTE
13 B
ORROWED
F
UNDS
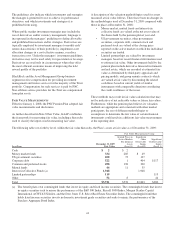
Bank notes along with senior and subordinated notes consisted
of the following:
December 31, 2009
Dollars in millions Outstanding Stated Rate Maturity
Bank notes $ 2,677 zero – 5.70% 2010 – 2047
Senior debt 9,685 .42 – 6.70% 2010 – 2020
Bank notes and
senior debt $12,362
Subordinated debt
Junior $ 3,022 .83 – 10.18% 2028 – 2068
Other 6,885 .60 – 8.11% 2010 – 2019
Subordinated debt $ 9,907
Included in outstandings for the senior and subordinated notes
in the table above are basis adjustment increases of $53
million and $154 million, respectively, related to fair value
accounting hedges as of December 31, 2009.
Total borrowed funds of $39.3 billion at December 31, 2009
have scheduled or anticipated repayments as follows:
• 2010: $13.0 billion,
• 2011: $4.9 billion,
• 2012: $5.5 billion,
• 2013: $3.4 billion,
• 2014: $2.1 billion, and
• 2015 and thereafter: $10.4 billion.
Included in borrowed funds are FHLB borrowings of
$10.8 billion at December 31, 2009, which are
collateralized by a blanket lien on residential mortgage and
other real estate-related loans. FHLB advances of $4.2 billion
have scheduled maturities of less than one year. The
remainder of the FHLB borrowings have balances that will
mature from 2011 – 2030, with interest rates ranging from
zero to 7.33%.
132