PNC Bank 2009 Annual Report Download - page 128
Download and view the complete annual report
Please find page 128 of the 2009 PNC Bank annual report below. You can navigate through the pages in the report by either clicking on the pages listed below, or by using the keyword search tool below to find specific information within the annual report.-
 1
1 -
2
-
3
-
4
-
5
-
6
-
7
-
8
-
9
-
10
-
11
-
12
-
13
-
14
-
15
-
16
-
17
-
18
-
19
-
20
-
21
-
22
-
23
-
24
-
25
-
26
-
27
-
28
-
29
-
30
-
31
-
32
-
33
-
34
-
35
-
36
-
37
-
38
-
39
-
40
-
41
-
42
-
43
-
44
-
45
-
46
-
47
-
48
-
49
-
50
-
51
-
52
-
53
-
54
-
55
-
56
-
57
-
58
-
59
-
60
-
61
-
62
-
63
-
64
-
65
-
66
-
67
-
68
-
69
-
70
-
71
-
72
-
73
-
74
-
75
-
76
-
77
-
78
-
79
-
80
-
81
-
82
-
83
-
84
-
85
-
86
-
87
-
88
-
89
-
90
-
91
-
92
-
93
-
94
-
95
-
96
-
97
-
98
-
99
-
100
-
101
-
102
-
103
-
104
-
105
-
106
-
107
-
108
-
109
-
110
-
111
-
112
-
113
-
114
-
115
-
116
-
117
-
 118
118 -
 119
119 -
 120
120 -
 121
121 -
 122
122 -
 123
123 -
 124
124 -
 125
125 -
 126
126 -
 127
127 -
 128
128 -
 129
129 -
 130
130 -
 131
131 -
 132
132 -
 133
133 -
 134
134 -
 135
135 -
 136
136 -
 137
137 -
 138
138 -
139
-
140
-
141
-
142
-
143
-
144
-
145
-
146
-
147
-
148
-
149
-
150
-
151
-
152
-
153
-
154
-
155
-
156
-
157
-
158
-
159
-
160
-
161
-
162
-
163
-
164
-
165
-
166
-
167
-
168
-
169
-
170
-
171
-
172
-
173
-
174
-
175
-
176
-
177
-
178
-
179
-
180
-
181
-
182
-
183
-
184
-
185
-
186
-
187
-
188
-
189
-
190
-
191
-
192
-
193
-
194
-
195
-
196
 |
 |

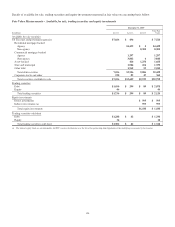
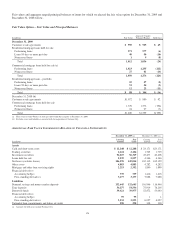
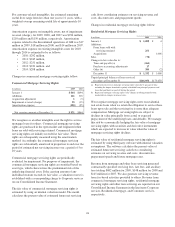
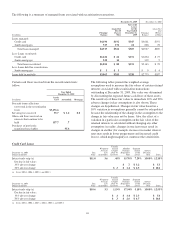
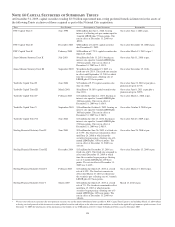
Fair values and aggregate unpaid principal balances of items for which we elected the fair value option for December 31, 2009 and
December 31, 2008 follow.
Fair Value Option – Fair Value and Principal Balances
In millions Fair Value
Aggregate Unpaid
Principal Balance Difference
December 31, 2009
Customer resale agreements $ 990 $ 925 $ 65
Residential mortgage loans held for sale
Performing loans 971 977 (6)
Loans 90 days or more past due 40 50 (10)
Nonaccrual loans 1 9 (8)
Total 1,012 1,036 (24)
Commercial mortgage loans held for sale (a)
Performing loans 1,023 1,235 (212)
Nonaccrual loans 27 41 (14)
Total 1,050 1,276 (226)
Residential mortgage loans – portfolio
Performing loans 25 27 (2)
Loans 90 days or more past due 51 54 (3)
Nonaccrual loans 12 23 (11)
Total $ 88 $ 104 $ (16)
December 31, 2008 (b)
Customer resale agreements $1,072 $ 980 $ 92
Commercial mortgage loans held for sale
Performing loans 1,376 1,572 (196)
Nonaccrual loans 24 27 (3)
Total $1,400 $1,599 $(199)
(a) There were no loans 90 days or more past due within this category at December 31, 2009.
(b) Excludes assets and liabilities associated with the acquisition of National City.
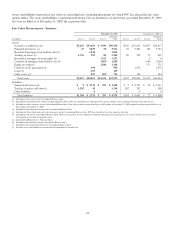
A
DDITIONAL
F
AIR
V
ALUE
I
NFORMATION
R
ELATED TO
F
INANCIAL
I
NSTRUMENTS
December 31, 2009 (a) December 31, 2008 (a)
In millions
Carrying
Amount
Fair
Value
Carrying
Amount
Fair
Value
Assets
Cash and short-term assets $ 12,248 $ 12,248 $ 23,171 $23,171
Trading securities 2,124 2,124 1,725 1,725
Investment securities 56,027 56,319 43,473 43,406
Loans held for sale 2,539 2,597 4,366 4,366
Net loans (excludes leases) 146,270 145,014 165,112 162,159
Other assets 4,883 4,883 4,282 4,282
Mortgage and other loan servicing rights 2,253 2,352 1,890 1,899
Financial derivatives
Accounting hedges 739 739 1,416 1,416
Free-standing derivatives 3,177 3,177 7,088 7,088
Liabilities
Demand, savings and money market deposits 132,645 132,645 116,946 116,946
Time deposits 54,277 54,534 75,919 76,205
Borrowed funds 39,621 39,977 52,872 53,063
Financial derivatives
Accounting hedges 95 95 11
Free-standing derivatives 3,533 3,533 6,057 6,057
Unfunded loan commitments and letters of credit 290 290 338 338
(a) Amounts for both years include National City.
124