PNC Bank 2009 Annual Report Download - page 42
Download and view the complete annual report
Please find page 42 of the 2009 PNC Bank annual report below. You can navigate through the pages in the report by either clicking on the pages listed below, or by using the keyword search tool below to find specific information within the annual report.-
 1
1 -
2
-
3
-
4
-
5
-
6
-
7
-
8
-
9
-
10
-
11
-
12
-
13
-
14
-
15
-
16
-
17
-
18
-
19
-
20
-
21
-
22
-
23
-
24
-
25
-
26
-
27
-
28
-
29
-
30
-
31
-
 32
32 -
 33
33 -
 34
34 -
 35
35 -
 36
36 -
 37
37 -
 38
38 -
 39
39 -
 40
40 -
 41
41 -
 42
42 -
 43
43 -
 44
44 -
 45
45 -
 46
46 -
 47
47 -
 48
48 -
 49
49 -
 50
50 -
 51
51 -
 52
52 -
53
-
54
-
55
-
56
-
57
-
58
-
59
-
60
-
61
-
62
-
63
-
64
-
65
-
66
-
67
-
68
-
69
-
70
-
71
-
72
-
73
-
74
-
75
-
76
-
77
-
78
-
79
-
80
-
81
-
82
-
83
-
84
-
85
-
86
-
87
-
88
-
89
-
90
-
91
-
92
-
93
-
94
-
95
-
96
-
97
-
98
-
99
-
100
-
101
-
102
-
103
-
104
-
105
-
106
-
107
-
108
-
109
-
110
-
111
-
112
-
113
-
114
-
115
-
116
-
117
-
118
-
119
-
120
-
121
-
122
-
123
-
124
-
125
-
126
-
127
-
128
-
129
-
130
-
131
-
132
-
133
-
134
-
135
-
136
-
137
-
138
-
139
-
140
-
141
-
142
-
143
-
144
-
145
-
146
-
147
-
148
-
149
-
150
-
151
-
152
-
153
-
154
-
155
-
156
-
157
-
158
-
159
-
160
-
161
-
162
-
163
-
164
-
165
-
166
-
167
-
168
-
169
-
170
-
171
-
172
-
173
-
174
-
175
-
176
-
177
-
178
-
179
-
180
-
181
-
182
-
183
-
184
-
185
-
186
-
187
-
188
-
189
-
190
-
191
-
192
-
193
-
194
-
195
-
196
 |
 |

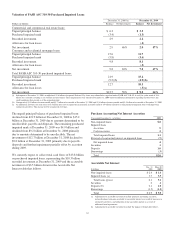
Goodwill and Other Intangible Assets
Goodwill increased $637 million and other intangible assets
increased $584 million at December 31, 2009 compared with
December 31, 2008. Note 2 Acquisitions and Divestitures and
Note 9 Goodwill and Other Intangible Assets in the Notes To
Consolidated Financial Statements in Item 8 of this Report
have further details on the National City-related items that
were the primary drivers of these increases.
F
UNDING AND
C
APITAL
S
OURCES
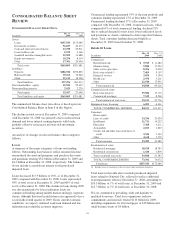
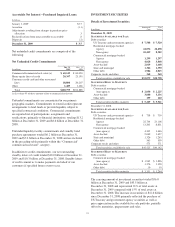
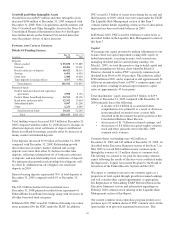
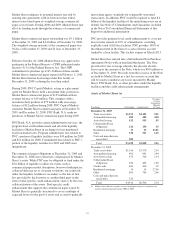
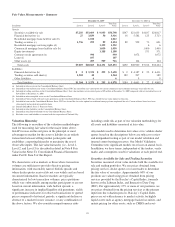
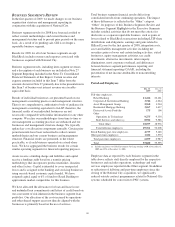
Details Of Funding Sources
In millions
Dec. 31
2009
Dec. 31
2008
Deposits
Money market $ 85,838 $ 77,889
Demand 40,406 33,001
Retail certificates of deposit 48,622 58,315
Savings 6,401 6,056
Other time 1,088 13,620
Time deposits in foreign offices 4,567 3,984
Total deposits 186,922 192,865
Borrowed funds
Federal funds purchased and repurchase
agreements 3,998 5,153
Federal Home Loan Bank borrowings 10,761 18,126
Bank notes and senior debt 12,362 13,664
Subordinated debt 9,907 11,208
Other 2,233 4,089
Total borrowed funds 39,261 52,240
Total $226,183 $245,105
Total funding sources decreased $18.9 billion at December 31,
2009 compared with December 31, 2008 driven by declines in
other time deposits, retail certificates of deposit and Federal
Home Loan Bank borrowings, partially offset by increases in
money market and demand deposits.
Total deposits decreased $5.9 billion at December 31, 2009
compared with December 31, 2008. Relationship-growth
driven increases in money market, demand and savings
deposits were more than offset by declines in other time
deposits, reflecting a planned run-off of brokered certificates
of deposits, and non-relationship retail certificates of deposits.
We anticipate that growth in relationship-based deposits will
be offset by additional run-off of higher-cost retail time
deposits in 2010.
Interest-bearing deposits represented 76% of total deposits at
December 31, 2009 compared with 81% at December 31,
2008.
The $13.0 billion decline in borrowed funds since
December 31, 2008 primarily resulted from repayments of
Federal Home Loan Bank borrowings along with decreases in
all other borrowed fund categories.
In March 2009, PNC issued $1.0 billion of floating rate senior
notes guaranteed by the FDIC under the TLGP. In addition,
PNC issued $1.5 billion of senior notes during the second and
third quarters of 2009, which were not issued under the TLGP.
The Liquidity Risk Management section of this Item 7
contains further details regarding actions we have taken which
impacted our borrowed funds balances in 2009.
In February 2010, PNC issued $2.0 billion of senior notes as
described further in the Liquidity Risk Management section of
this Item 7.
Capital
We manage our capital position by making adjustments to our
balance sheet size and composition, issuing debt, equity or
hybrid instruments, executing treasury stock transactions,
managing dividend policies and retaining earnings. On
March 1, 2009, we took the proactive step to build capital and
further strengthen our balance sheet when the Board of
Directors decided to reduce PNC’s quarterly common stock
dividend from $0.66 to $0.10 per share. The reduction added
$766 million in 2009, and is expected to add approximately $1
billion on an annualized basis, to PNC’s common equity and
cash positions, resulting in annual improvement in capital
ratios of approximately 40 basis points.
Total shareholders’ equity increased $4.5 billion, to $29.9
billion, at December 31, 2009 compared with December 31,
2008 primarily due to the following:
• A decline of $2.0 billion in accumulated other
comprehensive loss primarily as a result of decreases
in net unrealized securities losses as more fully
described in the Investment Securities portion of this
Consolidated Balance Sheet Review,
• An increase of $1.7 billion in retained earnings, and
• An increase of $.6 billion in capital surplus-common
stock and other, primarily due to the May 2009
common stock issuance.
Common shares outstanding were 462 million at
December 31, 2009 and 443 million at December 31, 2008. As
described in the Executive Summary section of this Item 7, in
May 2009 we raised $624 million in new common equity
through the issuance of 15 million shares of common stock.
The offering was related to our plan for increasing common
equity following the results of the stress tests conducted under
the Supervisory Capital Assessment Program by the Board of
Governors of the Federal Reserve System and the OCC.
We expect to continue to increase our common equity as a
proportion of total capital through growth in retained earnings
and will consider other capital opportunities as appropriate.
See Repurchase of Outstanding TARP Preferred Stock in the
Executive Summary section and information regarding our
February 2010 common stock offering in the Liquidity Risk
Management section of this Report.
Our current common stock repurchase program permits us to
purchase up to 25 million shares of PNC common stock on the
open market or in privately negotiated transactions. This
38