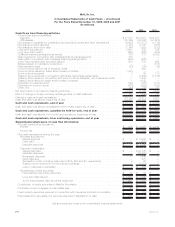
MetLife 2009 Annual Report Download - page 93
Download and view the complete annual report
Please find page 93 of the 2009 MetLife annual report below. You can navigate through the pages in the report by either clicking on the pages listed below, or by using the keyword search tool below to find specific information within the annual report.-
 1
1 -
2
-
3
-
4
-
5
-
6
-
7
-
8
-
9
-
10
-
11
-
12
-
13
-
14
-
15
-
16
-
17
-
18
-
19
-
20
-
21
-
22
-
23
-
24
-
25
-
26
-
27
-
28
-
29
-
30
-
31
-
32
-
33
-
34
-
35
-
36
-
37
-
38
-
39
-
40
-
41
-
42
-
43
-
44
-
45
-
46
-
47
-
48
-
49
-
50
-
51
-
52
-
53
-
54
-
55
-
56
-
57
-
58
-
59
-
60
-
61
-
62
-
63
-
64
-
65
-
66
-
67
-
68
-
69
-
70
-
71
-
72
-
73
-
74
-
75
-
76
-
77
-
78
-
79
-
80
-
81
-
82
-
 83
83 -
 84
84 -
 85
85 -
 86
86 -
 87
87 -
 88
88 -
 89
89 -
 90
90 -
 91
91 -
 92
92 -
 93
93 -
 94
94 -
 95
95 -
 96
96 -
 97
97 -
 98
98 -
 99
99 -
 100
100 -
 101
101 -
 102
102 -
 103
103 -
104
-
105
-
106
-
107
-
108
-
109
-
110
-
111
-
112
-
113
-
114
-
115
-
116
-
117
-
118
-
119
-
120
-
121
-
122
-
123
-
124
-
125
-
126
-
127
-
128
-
129
-
130
-
131
-
132
-
133
-
134
-
135
-
136
-
137
-
138
-
139
-
140
-
141
-
142
-
143
-
144
-
145
-
146
-
147
-
148
-
149
-
150
-
151
-
152
-
153
-
154
-
155
-
156
-
157
-
158
-
159
-
160
-
161
-
162
-
163
-
164
-
165
-
166
-
167
-
168
-
169
-
170
-
171
-
172
-
173
-
174
-
175
-
176
-
177
-
178
-
179
-
180
-
181
-
182
-
183
-
184
-
185
-
186
-
187
-
188
-
189
-
190
-
191
-
192
-
193
-
194
-
195
-
196
-
197
-
198
-
199
-
200
-
201
-
202
-
203
-
204
-
205
-
206
-
207
-
208
-
209
-
210
-
211
-
212
-
213
-
214
-
215
-
216
-
217
-
218
-
219
-
220
 |
 |
MetLife, Inc.
Notes to the Consolidated Financial Statements
1. Business, Basis of Presentation and Summary of Significant Accounting Policies
Business
“MetLife” or the “Company” refers to MetLife, Inc., a Delaware corporation incorporated in 1999 (the “Holding Company”), and its
subsidiaries, including Metropolitan Life Insurance Company (“MLIC”). MetLife is a leading provider of insurance, employee benefits and
financial services with operations throughout the United States and the Latin America, Asia Pacific and Europe, Middle East and India regions.
Through its subsidiaries and affiliates, MetLife offers life insurance, annuities, auto and home insurance, retail banking and other financial
services to individuals, as well as group insurance and retirement & savings products and services to corporations and other institutions.
During 2009, MetLife combined its former institutional and individual businesses, as well as its auto & home unit, into a single
U.S. Business organization. U.S. Business consists of Insurance Products, Retirement Products, Corporate Benefit Funding and Auto &
Home segments. The Company also has an International segment. The segments are managed separately because they either provide
different products and services, require different strategies or have different technology requirements. In addition, the Company reports
certain of its results of operations in Banking, Corporate & Other, which is comprised of MetLife Bank, National Association (“MetLife Bank”)
and other business activities. See Note 22 for further business segment information.
Basis of Presentation
The accompanying consolidated financial statements include the accounts of the Holding Company and its subsidiaries, partnerships and
joint ventures in which the Company has control, and variable interest entities (“VIEs”) for which the Company is the primary beneficiary.
Closed block assets, liabilities, revenues and expenses are combined on a line-by-line basis with the assets, liabilities, revenues and
expenses outside the closed block based on the nature of the particular item. See Note 10. Intercompany accounts and transactions have
been eliminated.
Certain amounts in the prior year periods’ consolidated financial statements have been reclassified to conform with the 2009 presentation.
Such reclassifications include $6.9 billion reclassified from policyholder account balances to bank deposits in the consolidated balance
sheet at December 31, 2008 and $2,185 million and ($305) million reclassified from policyholder account balances to net change in bank
deposits within cash flows from financing activities in the consolidated statements of cash flows for the years ended December 31, 2008 and
2007, respectively. See also Note 23 for reclassifications related to discontinued operations.
Summary of Significant Accounting Policies and Critical Accounting Estimates
The preparation of financial statements in conformity with accounting principles generally accepted in the United States of America
(“GAAP”) requires management to adopt accounting policies and make estimates and assumptions that affect amounts reported in the
consolidated financial statements.
A description of critical estimates is incorporated within the discussion of the related accounting policies which follows. In applying these
policies, management makes subjective and complex judgments that frequently require estimates about matters that are inherently
uncertain. Many of these policies, estimates and related judgments are common in the insurance and financial services industries; others
are specific to the Company’s businesses and operations. Actual results could differ from these estimates.
In June 2009, the Financial Accounting Standards Board (“FASB”) approved FASB Accounting Standards Codification (“Codification”) as
the single source of authoritative accounting guidance used in the preparation of financial statements in conformity with GAAP for all non-
governmental entities. Codification changed the referencing and organization of accounting guidance without modification of existing GAAP.
Since it did not modify existing GAAP, Codification did not have any impact on the Company’s financial condition or results of operations. On
the effective date of Codification, substantially all existing non-SEC accounting and reporting standards were superseded and, therefore, are
no longer referenced by title in the accompanying consolidated financial statements.
Fair Value
As described below, certain assets and liabilities are measured at estimated fair value on the Company’s consolidated balance sheets. In
addition, the notes to these consolidated financial statements include further disclosures of estimated fair values. The Company defines fair
value as the price that would be received to sell an asset or paid to transfer a liability (an exit price) in the principal or most advantageous
market for the asset or liability in an orderly transaction between market participants on the measurement date. In many cases, the exit price
and the transaction (or entry) price will be the same at initial recognition. However, in certain cases, the transaction price may not represent fair
value. The fair value of a liability is based on the amount that would be paid to transfer a liability to a third-party with the same credit standing. It
requires that fair value be a market-based measurement in which the fair value is determined based on a hypothetical transaction at the
measurement date, considered from the perspective of a market participant. When quoted prices are not used to determine fair value the
Company considers three broad valuation techniques: (i) the market approach, (ii) the income approach and (iii) the cost approach. The
Company determines the most appropriate valuation technique to use, given what is being measured and the availability of sufficient inputs.
The Company prioritizes the inputs to fair valuation techniques and allows for the use of unobservable inputs to the extent that observable
inputs are not available. The Company categorizes its assets and liabilities measured at estimated fair value into a three-level hierarchy, based
on the priority of the inputs to the respective valuation technique. The fair value hierarchy gives the highest priority to quoted prices in active
markets for identical assets or liabilities (Level 1) and the lowest priority to unobservable inputs (Level 3). An asset or liability’s classification
within the fair value hierarchy is based on the lowest level of input to its valuation. The input levels are as follows:
Level 1 Unadjusted quoted prices in active markets for identical assets or liabilities. The Company defines active markets based on
average trading volume for equity securities. The size of the bid/ask spread is used as an indicator of market activity for fixed
maturity securities.
Level 2 Quoted prices in markets that are not active or inputs that are observable either directly or indirectly. Level 2 inputs include quoted
prices for similar assets or liabilities other than quoted prices inLevel1;quotedpricesinmarketsthatarenotactive;orother
significant inputs that are observable or can be derived principally from or corroborated by observable market data for
substantially the full term of the assets or liabilities.
F-9MetLife, Inc.