MetLife 2009 Annual Report Download - page 127
Download and view the complete annual report
Please find page 127 of the 2009 MetLife annual report below. You can navigate through the pages in the report by either clicking on the pages listed below, or by using the keyword search tool below to find specific information within the annual report.-
 1
1 -
2
-
3
-
4
-
5
-
6
-
7
-
8
-
9
-
10
-
11
-
12
-
13
-
14
-
15
-
16
-
17
-
18
-
19
-
20
-
21
-
22
-
23
-
24
-
25
-
26
-
27
-
28
-
29
-
30
-
31
-
32
-
33
-
34
-
35
-
36
-
37
-
38
-
39
-
40
-
41
-
42
-
43
-
44
-
45
-
46
-
47
-
48
-
49
-
50
-
51
-
52
-
53
-
54
-
55
-
56
-
57
-
58
-
59
-
60
-
61
-
62
-
63
-
64
-
65
-
66
-
67
-
68
-
69
-
70
-
71
-
72
-
73
-
74
-
75
-
76
-
77
-
78
-
79
-
80
-
81
-
82
-
83
-
84
-
85
-
86
-
87
-
88
-
89
-
90
-
91
-
92
-
93
-
94
-
95
-
96
-
97
-
98
-
99
-
100
-
101
-
102
-
103
-
104
-
105
-
106
-
107
-
108
-
109
-
110
-
111
-
112
-
113
-
114
-
115
-
116
-
 117
117 -
 118
118 -
 119
119 -
 120
120 -
 121
121 -
 122
122 -
 123
123 -
 124
124 -
 125
125 -
 126
126 -
 127
127 -
 128
128 -
 129
129 -
 130
130 -
 131
131 -
 132
132 -
 133
133 -
 134
134 -
 135
135 -
 136
136 -
 137
137 -
138
-
139
-
140
-
141
-
142
-
143
-
144
-
145
-
146
-
147
-
148
-
149
-
150
-
151
-
152
-
153
-
154
-
155
-
156
-
157
-
158
-
159
-
160
-
161
-
162
-
163
-
164
-
165
-
166
-
167
-
168
-
169
-
170
-
171
-
172
-
173
-
174
-
175
-
176
-
177
-
178
-
179
-
180
-
181
-
182
-
183
-
184
-
185
-
186
-
187
-
188
-
189
-
190
-
191
-
192
-
193
-
194
-
195
-
196
-
197
-
198
-
199
-
200
-
201
-
202
-
203
-
204
-
205
-
206
-
207
-
208
-
209
-
210
-
211
-
212
-
213
-
214
-
215
-
216
-
217
-
218
-
219
-
220
 |
 |

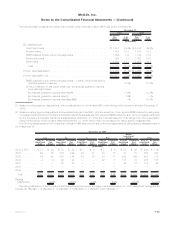
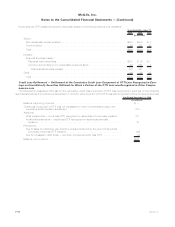
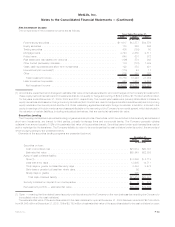
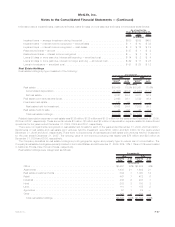
Net Investment Income
The components of net investment income are as follows:
2009 2008 2007
Years Ended December 31,
(In millions)
Fixedmaturitysecurities......................................... $11,617 $13,577 $14,576
Equitysecurities .............................................. 178 258 265
Tradingsecurities ............................................. 400 (193) 50
Mortgageloans............................................... 2,743 2,855 2,811
Policyloans................................................. 648 601 572
Realestateandrealestatejointventures .............................. (196) 574 943
Otherlimitedpartnershipinterests................................... 174 (170) 1,309
Cash,cashequivalentsandshort-terminvestments ....................... 129 353 491
Internationaljointventures(1)...................................... (115) 43 17
Other ..................................................... 205 350 320
Totalinvestmentincome........................................ 15,783 18,248 21,354
Less:Investmentexpenses....................................... 945 1,957 3,297
Netinvestmentincome ........................................ $14,838 $16,291 $18,057
(1) Amounts are presented net of changes in estimated fair value of derivatives related to economic hedges of the Company’s investment in
these equity method international joint investments that do not qualify for hedge accounting of ($143) million, $178 million and $12 million
for the years ended December 31, 2009, 2008 and 2007, respectively. The current year losses were primarily attributable to losses on
equity derivatives and losses on foreign currency derivatives (both of which are used to hedge embedded derivative risk) due to improving
equity markets in the current period and the U.S. Dollar weakening against several major foreign currencies. In addition, included in the
equity in earnings of the joint ventures were losses attributable to the narrowing of the Company’s own credit spread, which is included in
the valuation of certain liabilities, including embedded derivatives, that are carried at estimated fair value.
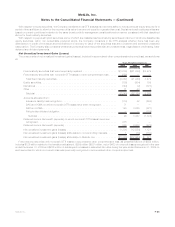
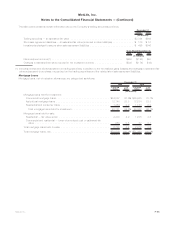
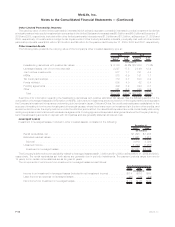
Securities Lending
The Company participates in securities lending programs whereby blocks of securities, which are included in fixed maturity securities and
short-term investments, are loaned to third parties, primarily brokerage firms and commercial banks. The Company generally obtains
collateral in an amount equal to 102% of the estimated fair value of the securities loaned. Securities loaned under such transactions may be
sold or repledged by the transferee. The Company is liable to return to its counterparties the cash collateral under its control, the amounts of
which by aging category are presented below.
Elements of the securities lending programs are presented below at:
2009 2008
December 31,
(In millions)
Securities on loan:
Costoramortizedcost................................................ $21,012 $20,791
Estimatedfairvalue .................................................. $20,949 $22,885
Aging of cash collateral liability:
Open(1).......................................................... $ 3,290 $ 5,118
Lessthanthirtydays ................................................. 13,605 14,711
Thirtydaysorgreaterbutlessthansixtydays ................................. 3,534 3,472
Sixtydaysorgreaterbutlessthanninetydays................................. 92 —
Ninetydaysorgreater ................................................ 995 —
Totalcashcollateralliability............................................ $21,516 $23,301
Securitycollateralondepositfromcounterparties ................................ $ 6 $ 279
Reinvestmentportfolio—estimatedfairvalue................................... $20,339 $19,509
(1) Open — meaning that the related loaned security could be returned to the Company on the next business day requiring the Company to
immediately return the cash collateral.
The estimated fair value of the securities related to the cash collateral on open at December 31, 2009 has been reduced to $3,193 million
from $4,986 million at December 31, 2008. Of the $3,193 million of estimated fair value of the securities related to the cash collateral on open
F-43MetLife, Inc.
MetLife, Inc.
Notes to the Consolidated Financial Statements — (Continued)