MetLife 2009 Annual Report Download - page 59
Download and view the complete annual report
Please find page 59 of the 2009 MetLife annual report below. You can navigate through the pages in the report by either clicking on the pages listed below, or by using the keyword search tool below to find specific information within the annual report.-
 1
1 -
2
-
3
-
4
-
5
-
6
-
7
-
8
-
9
-
10
-
11
-
12
-
13
-
14
-
15
-
16
-
17
-
18
-
19
-
20
-
21
-
22
-
23
-
24
-
25
-
26
-
27
-
28
-
29
-
30
-
31
-
32
-
33
-
34
-
35
-
36
-
37
-
38
-
39
-
40
-
41
-
42
-
43
-
44
-
45
-
46
-
47
-
48
-
 49
49 -
 50
50 -
 51
51 -
 52
52 -
 53
53 -
 54
54 -
 55
55 -
 56
56 -
 57
57 -
 58
58 -
 59
59 -
 60
60 -
 61
61 -
 62
62 -
 63
63 -
 64
64 -
 65
65 -
 66
66 -
 67
67 -
 68
68 -
 69
69 -
70
-
71
-
72
-
73
-
74
-
75
-
76
-
77
-
78
-
79
-
80
-
81
-
82
-
83
-
84
-
85
-
86
-
87
-
88
-
89
-
90
-
91
-
92
-
93
-
94
-
95
-
96
-
97
-
98
-
99
-
100
-
101
-
102
-
103
-
104
-
105
-
106
-
107
-
108
-
109
-
110
-
111
-
112
-
113
-
114
-
115
-
116
-
117
-
118
-
119
-
120
-
121
-
122
-
123
-
124
-
125
-
126
-
127
-
128
-
129
-
130
-
131
-
132
-
133
-
134
-
135
-
136
-
137
-
138
-
139
-
140
-
141
-
142
-
143
-
144
-
145
-
146
-
147
-
148
-
149
-
150
-
151
-
152
-
153
-
154
-
155
-
156
-
157
-
158
-
159
-
160
-
161
-
162
-
163
-
164
-
165
-
166
-
167
-
168
-
169
-
170
-
171
-
172
-
173
-
174
-
175
-
176
-
177
-
178
-
179
-
180
-
181
-
182
-
183
-
184
-
185
-
186
-
187
-
188
-
189
-
190
-
191
-
192
-
193
-
194
-
195
-
196
-
197
-
198
-
199
-
200
-
201
-
202
-
203
-
204
-
205
-
206
-
207
-
208
-
209
-
210
-
211
-
212
-
213
-
214
-
215
-
216
-
217
-
218
-
219
-
220
 |
 |

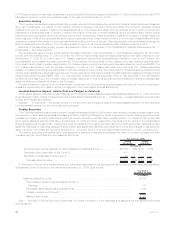
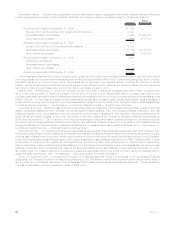
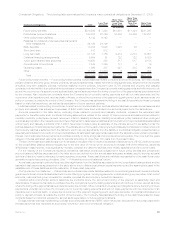
The table below contains the carrying value for guarantees included in policyholder account balances at:
2009 2008
December 31,
(In millions)
U.S. Business:
Guaranteedminimumaccumulationbenefit ...................................... $ 60 $ 169
Guaranteedminimumwithdrawalbenefit ........................................ 154 750
Guaranteedminimumincomebenefit .......................................... 66 1,043
International:
Guaranteedminimumaccumulationbenefit ...................................... 195 271
Guaranteedminimumwithdrawalbenefit ........................................ 1,025 901
Total ............................................................... $1,500 $3,134
Included in net investment gains (losses) for the year ended December 31, 2009 and 2008 were gains (losses) of $1.8 billion and
($2.7) billion, respectively, in embedded derivatives related to the change in estimated fair value of the above guarantees. The carrying
amount of guarantees accounted for at estimated fair value includes an adjustment for the Company’s own credit. In connection with this
adjustment, gains (losses) of ($1.9) billion and $3.0 billion are included in the gains (losses) of $1.8 billion and ($2.7) billion in net investment
gains (losses) for the year ended December 31, 2009 and 2008, respectively.
The estimated fair value of guarantees accounted for as embedded derivatives can change significantly during periods of sizable and
sustained shifts in equity market performance, equity volatility, interest rates or foreign exchange rates. Additionally, because the estimated
fair value for guarantees accounted for at estimated fair value includes an adjustment for the Company’s own credit, a decrease in the
Company’s credit spreads could cause the value of these liabilities to increase. Conversely, a widening of the Company’s credit spreads
could cause the value of these liabilities to decrease. The Company uses derivative instruments to mitigate the liability exposure, risk of loss
and the volatility of net income associated with these liabilities. The derivative instruments used are primarily equity and treasury futures,
equity options and variance swaps, and interest rate swaps. The change in valuation arising from the Company’s own credit is not hedged.
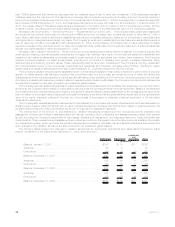
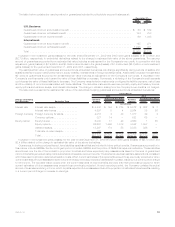
The table below presents the estimated fair value of the derivatives hedging guarantees accounted for as embedded derivatives:
Primary Underlying
Risk Exposure Derivative Type Notional
Amount Assets Liabilities Notional
Amount Assets Liabilities
Estimated Fair Value Estimated Fair Value
2009 2008
December 31,
(In millions)
Interest rate Interest rate swaps . . . . . . . . . . . . . $ 8,847 $ 194 $ 275 $ 5,572 $ 632 $ 7
Interest rate futures . . . . . . . . . . . . . 4,997 5 4 9,264 36 56
Foreign currency Foreign currency forwards . . . . . . . . . 2,016 4 30 1,017 49 4
Currencyoptions............... 327 14 — 582 68 —
Equitymarket Equityfutures................. 6,033 31 20 4,660 1 65
Equity options . . . . . . . . . . . . . . . . . 26,661 1,596 1,018 4,842 1,997 —
Variance swaps . . . . . . . . . . . . . . . . 13,267 174 58 8,835 396 —
Totalrateofreturnswaps ......... 126 — — — — —
Total . . . . . . . . . . . . . . . . . . . . . . . $62,274 $2,018 $1,405 $34,772 $3,179 $132
Included in net investment gains (losses) for the year ended December 31, 2009 and 2008 were gains (losses) of ($3.7) billion and
$3.4 billion related to the change in estimated fair value of the above derivatives.
Guarantees, including portions thereof, have liabilities established that are included in future policy benefits. Guarantees accounted for in
this manner include GMDBs, the life-contingent portion of certain GMWB, and the portion of GMIB that require annuitization. These liabilities
are accrued over the life of the contract in proportion to actual and future expected policy assessments based on the level of guaranteed
minimum benefits generated using multiple scenarios of separate account returns. The scenarios use best estimate assumptions consistent
with those used to amortize deferred acquisition costs. When current estimates of future benefits exceed those previously projected or when
current estimates of future assessments are lower than those previously projected, liabilities will increase, resulting in a current period charge
to net income. The opposite result occurs when the current estimates of future benefits are lower than that previously projected or when
current estimates of future assessments exceed those previously projected. At each reporting period, the Company updates the actual
amount of business remaining in-force, which impacts expected future assessments and the projection of estimated future benefits resulting
in a current period charge or increase to earnings.
53MetLife, Inc.