MetLife 2009 Annual Report Download - page 131
Download and view the complete annual report
Please find page 131 of the 2009 MetLife annual report below. You can navigate through the pages in the report by either clicking on the pages listed below, or by using the keyword search tool below to find specific information within the annual report.-
 1
1 -
2
-
3
-
4
-
5
-
6
-
7
-
8
-
9
-
10
-
11
-
12
-
13
-
14
-
15
-
16
-
17
-
18
-
19
-
20
-
21
-
22
-
23
-
24
-
25
-
26
-
27
-
28
-
29
-
30
-
31
-
32
-
33
-
34
-
35
-
36
-
37
-
38
-
39
-
40
-
41
-
42
-
43
-
44
-
45
-
46
-
47
-
48
-
49
-
50
-
51
-
52
-
53
-
54
-
55
-
56
-
57
-
58
-
59
-
60
-
61
-
62
-
63
-
64
-
65
-
66
-
67
-
68
-
69
-
70
-
71
-
72
-
73
-
74
-
75
-
76
-
77
-
78
-
79
-
80
-
81
-
82
-
83
-
84
-
85
-
86
-
87
-
88
-
89
-
90
-
91
-
92
-
93
-
94
-
95
-
96
-
97
-
98
-
99
-
100
-
101
-
102
-
103
-
104
-
105
-
106
-
107
-
108
-
109
-
110
-
111
-
112
-
113
-
114
-
115
-
116
-
117
-
118
-
119
-
120
-
 121
121 -
 122
122 -
 123
123 -
 124
124 -
 125
125 -
 126
126 -
 127
127 -
 128
128 -
 129
129 -
 130
130 -
 131
131 -
 132
132 -
 133
133 -
 134
134 -
 135
135 -
 136
136 -
 137
137 -
 138
138 -
 139
139 -
 140
140 -
 141
141 -
142
-
143
-
144
-
145
-
146
-
147
-
148
-
149
-
150
-
151
-
152
-
153
-
154
-
155
-
156
-
157
-
158
-
159
-
160
-
161
-
162
-
163
-
164
-
165
-
166
-
167
-
168
-
169
-
170
-
171
-
172
-
173
-
174
-
175
-
176
-
177
-
178
-
179
-
180
-
181
-
182
-
183
-
184
-
185
-
186
-
187
-
188
-
189
-
190
-
191
-
192
-
193
-
194
-
195
-
196
-
197
-
198
-
199
-
200
-
201
-
202
-
203
-
204
-
205
-
206
-
207
-
208
-
209
-
210
-
211
-
212
-
213
-
214
-
215
-
216
-
217
-
218
-
219
-
220
 |
 |

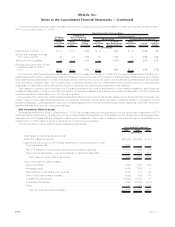
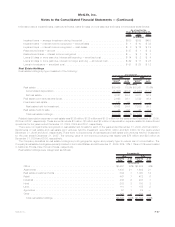
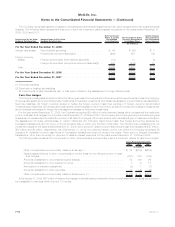
Information about impaired loans, restructured loans, loans 90 days or more past due and loans in foreclosure is as follows:
2009 2008 2007
As of and for the
Years Ended December 31,
(In millions)
Impairedloans—averageinvestmentduringtheperiod.......................... $338 $389 $453
Impairedloans—interestincomerecognized—accrualbasis ..................... $ 1 $ 10 $ 38
Impairedloans—interestincomerecognized—cashbasis....................... $ 8 $ 12 $ 19
Restructuredloans—amount .......................................... $ 37 $ 1 $ 2
Restructuredloans—interestincomerecognized ............................. $ — $ 1 $ 1
Loans 90 days or more past due, interest still accruing — amortized cost . . . . . . . . . . . . . . $ 14 $ 2 $ 4
Loans 90 days or more past due, interest no longer accruing — amortized cost . . . . . . . . . . $ 62 $ 11 $ 28
Loansinforeclosure—amortizedcost..................................... $ 91 $ 28 $ 12
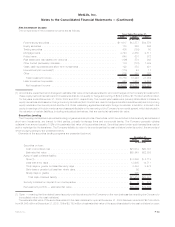
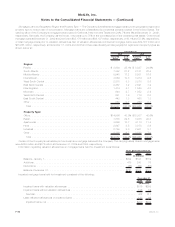
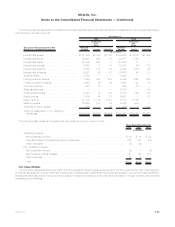
Real Estate Holdings
Real estate holdings by type consisted of the following:
Carrying
Value %of
Total Carrying
Value %of
Total
2009 2008
December 31,
(In millions)
Realestate .............................................. $5,435 78.8% $5,351 70.6%
Accumulateddepreciation................................... (1,408) (20.4) (1,340) (17.7)
Netrealestate .......................................... 4,027 58.4 4,011 52.9
Realestatejointventuresandfunds.............................. 2,698 39.1 3,522 46.4
Foreclosedrealestate....................................... 127 1.9 2 —
Realestateheld-for-investment................................ 6,852 99.4 7,535 99.3
Realestateheld-for-sale ..................................... 44 0.6 51 0.7
Total real estate holdings . . . . . . . . . . . . . . . . . . . . . . . . . . . . . . . . . . . . $ 6,896 100.0% $ 7,586 100.0%
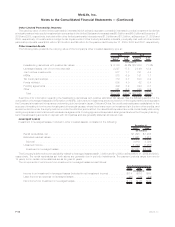
Related depreciation expense on real estate was $135 million, $136 million and $130 million for the years ended December 31, 2009,
2008 and 2007, respectively. These amounts include $1 million, $1 million and $3 million of depreciation expense related to discontinued
operations for the years ended December 31, 2009, 2008 and 2007, respectively.
There were no impairments recognized on real estate held-for-sale for each of the years ended December 31, 2009, 2008 and 2007.
Impairments of real estate and real estate joint ventures held-for-investment were $160 million and $20 million for the years ended
December 31, 2009 and 2008, respectively. There were no impairments of real estate and real estate joint ventures held-for-investment
for the year ended December 31, 2007. The carrying value of non-income producing real estate was $76 million and $28 million at
December 31, 2009 and 2008, respectively.
The Company diversifies its real estate holdings by both geographic region and property type to reduce risk of concentration. The
Company’s real estate holdings are primarily located in the United States, and at December 31, 2009, 23%, 13%, 11% and 10% were located
in California, Florida, New York and Texas, respectively.
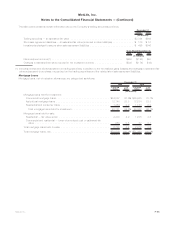
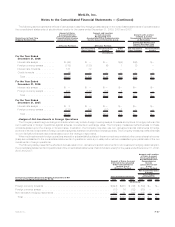
Real estate holdings were categorized as follows:
Carrying
Value %of
Total Carrying
Value %of
Total
2009 2008
December 31,
(In millions)
Office.................................................... $3,557 52% $3,489 46%
Apartments ................................................ 1,438 21 1,602 21
Realestateinvestmentfunds..................................... 504 7 1,080 14
Retail .................................................... 467 7 472 6
Industrial.................................................. 436 6 483 7
Hotel .................................................... 203 3 180 3
Land..................................................... 110 1 155 2
Agriculture................................................. 57 1 24 —
Other .................................................... 124 2 101 1
Totalrealestateholdings ...................................... $6,896 100% $7,586 100%
F-47MetLife, Inc.
MetLife, Inc.
Notes to the Consolidated Financial Statements — (Continued)