MetLife 2009 Annual Report Download - page 42
Download and view the complete annual report
Please find page 42 of the 2009 MetLife annual report below. You can navigate through the pages in the report by either clicking on the pages listed below, or by using the keyword search tool below to find specific information within the annual report.-
 1
1 -
2
-
3
-
4
-
5
-
6
-
7
-
8
-
9
-
10
-
11
-
12
-
13
-
14
-
15
-
16
-
17
-
18
-
19
-
20
-
21
-
22
-
23
-
24
-
25
-
26
-
27
-
28
-
29
-
30
-
31
-
 32
32 -
 33
33 -
 34
34 -
 35
35 -
 36
36 -
 37
37 -
 38
38 -
 39
39 -
 40
40 -
 41
41 -
 42
42 -
 43
43 -
 44
44 -
 45
45 -
 46
46 -
 47
47 -
 48
48 -
 49
49 -
 50
50 -
 51
51 -
 52
52 -
53
-
54
-
55
-
56
-
57
-
58
-
59
-
60
-
61
-
62
-
63
-
64
-
65
-
66
-
67
-
68
-
69
-
70
-
71
-
72
-
73
-
74
-
75
-
76
-
77
-
78
-
79
-
80
-
81
-
82
-
83
-
84
-
85
-
86
-
87
-
88
-
89
-
90
-
91
-
92
-
93
-
94
-
95
-
96
-
97
-
98
-
99
-
100
-
101
-
102
-
103
-
104
-
105
-
106
-
107
-
108
-
109
-
110
-
111
-
112
-
113
-
114
-
115
-
116
-
117
-
118
-
119
-
120
-
121
-
122
-
123
-
124
-
125
-
126
-
127
-
128
-
129
-
130
-
131
-
132
-
133
-
134
-
135
-
136
-
137
-
138
-
139
-
140
-
141
-
142
-
143
-
144
-
145
-
146
-
147
-
148
-
149
-
150
-
151
-
152
-
153
-
154
-
155
-
156
-
157
-
158
-
159
-
160
-
161
-
162
-
163
-
164
-
165
-
166
-
167
-
168
-
169
-
170
-
171
-
172
-
173
-
174
-
175
-
176
-
177
-
178
-
179
-
180
-
181
-
182
-
183
-
184
-
185
-
186
-
187
-
188
-
189
-
190
-
191
-
192
-
193
-
194
-
195
-
196
-
197
-
198
-
199
-
200
-
201
-
202
-
203
-
204
-
205
-
206
-
207
-
208
-
209
-
210
-
211
-
212
-
213
-
214
-
215
-
216
-
217
-
218
-
219
-
220
 |
 |

Quoted Prices
in Active
Markets for
Identical Assets
(Level 1)
Significant
Other
Observable
Inputs
(Level 2)
Significant
Unobservable
Inputs
(Level 3)
Total
Estimated
Fair Value
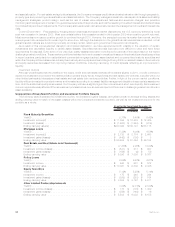
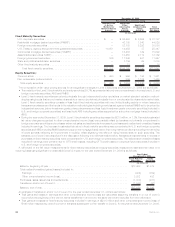
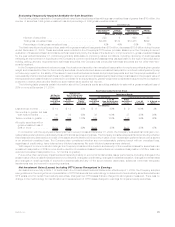
Fair Value Measurements Using
December 31, 2009
(In millions)
Fixed Maturity Securities:
U.S.corporatesecurities.................................. $ — $ 65,493 $ 6,694 $ 72,187
Residential mortgage-backed securities (“RMBS”) . . . . . . . . . . . . . . . . . . — 42,180 1,840 44,020
Foreigncorporatesecurities ................................ — 32,738 5,292 38,030
U.S. Treasury, agency and government guaranteed securities . . . . . . . . . . 10,951 14,459 37 25,447
Commercialmortgage-backedsecurities(“CMBS”) ................. — 15,483 139 15,622
Asset-backedsecurities(“ABS”).............................. — 10,450 2,712 13,162
Foreigngovernmentsecurities............................... 306 11,240 401 11,947
Stateandpoliticalsubdivisionsecurities ........................ — 7,139 69 7,208
Otherfixedmaturitysecurities............................... — 13 6 19
Totalfixedmaturitysecurities............................. $11,257 $199,195 $17,190 $227,642
Equity Securities:
Commonstock ........................................ $ 490 $ 995 $ 136 $ 1,621
Non-redeemablepreferredstock............................. — 359 1,104 1,463
Totalequitysecurities................................... $ 490 $ 1,354 $ 1,240 $ 3,084
The composition of fair value pricing sources for and significant changes in Level 3 securities at December 31, 2009 are as follows:
• The majority of the Level 3 fixed maturity and equity securities (89.7%, as presented above) were concentrated in four sectors: U.S. and
foreign corporate securities, ABS and RMBS.
• Level 3 fixed maturity securities are priced principally through independent broker quotations or market standard valuation method-
ologies using inputs that are not market observable or cannot be derived principally from or corroborated by observable market data.
Level 3 fixed maturity securities consists of less liquid fixed maturity securities with very limited trading activity or where less price
transparency exists around the inputs to the valuation methodologies including newly issued agency-backed RMBS yet to be priced by
independent sources, below investment grade private placements and less liquid investment grade corporate securities (included in
U.S. and foreign corporate securities) and less liquid ABS including securities supported by sub-prime mortgage loans (included in
ABS).
• During the year ended December 31, 2009, Level 3 fixed maturity securities decreased by $218 million, or 1.3%. Favorable estimated
fair value changes recognized in other comprehensive income (loss) were partially offset by transfers out primarily concentrated in
foreign corporate securities and to a lesser extent net sales and settlements in excess of purchases and realized and unrealized losses
included in earnings. The increase in estimated fair value in fixed maturity securities was concentrated in U.S. and foreign corporate
securities and ABS (including RMBS backed by sub-prime mortgage loans) due to improving market conditions including the narrowing
of credit spreads reflecting an improvement in liquidity, offset slightly by the effect of rising interest rates on such securities. The
transfers out of Level 3 are described in the discussion following the rollforward table below. Net sales and settlements in excess of
purchases of fixed maturity securities were concentrated in U.S. and foreign corporate securities. The realized and unrealized losses
included in earnings were primarily due to OTTI credit losses, including OTTI credit losses on perpetual hybrid securities included in
U.S. and foreign corporate securities.
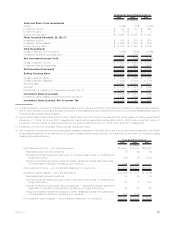
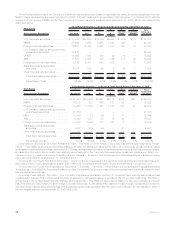
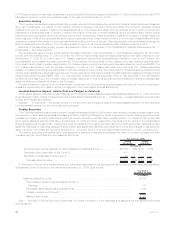
A rollforward of the fair value measurements for fixed maturity securities and equity securities measured at estimated fair value on a
recurring basis using significant unobservable (Level 3) inputs for the year ended December 31, 2009 is as follows:
Fixed Maturity
Securities Equity
Securities
Year Ended
December 31, 2009
(In millions)
Balance,beginningofyear................................................. $17,408 $1,379
Total realized/unrealized gains (losses) included in:
Earnings ........................................................... (924) (359)
Othercomprehensiveincome(loss).......................................... 3,252 492
Purchases,sales,issuancesandsettlements..................................... (1,003) (231)
Transfersinand/oroutofLevel3............................................. (1,543) (41)
Balance,endofyear..................................................... $17,190 $1,240
An analysis of transfers in and/or out of Level 3 for the year ended December 31, 2009 is as follows:
• Total gains and losses in earnings and other comprehensive income (loss) are calculated assuming transfers in or out of Level 3
occurred at the beginning of the period. Items transferred in and out for the same period are excluded from the rollforward.
• Total gains and losses for fixed maturity securities included in earnings of ($241) million and other comprehensive income (loss) of
$169 million respectively, were incurred for transfers subsequent to their transfer to Level 3, for the year ended December 31, 2009.
36 MetLife, Inc.