MetLife 2009 Annual Report Download - page 115
Download and view the complete annual report
Please find page 115 of the 2009 MetLife annual report below. You can navigate through the pages in the report by either clicking on the pages listed below, or by using the keyword search tool below to find specific information within the annual report.-
 1
1 -
2
-
3
-
4
-
5
-
6
-
7
-
8
-
9
-
10
-
11
-
12
-
13
-
14
-
15
-
16
-
17
-
18
-
19
-
20
-
21
-
22
-
23
-
24
-
25
-
26
-
27
-
28
-
29
-
30
-
31
-
32
-
33
-
34
-
35
-
36
-
37
-
38
-
39
-
40
-
41
-
42
-
43
-
44
-
45
-
46
-
47
-
48
-
49
-
50
-
51
-
52
-
53
-
54
-
55
-
56
-
57
-
58
-
59
-
60
-
61
-
62
-
63
-
64
-
65
-
66
-
67
-
68
-
69
-
70
-
71
-
72
-
73
-
74
-
75
-
76
-
77
-
78
-
79
-
80
-
81
-
82
-
83
-
84
-
85
-
86
-
87
-
88
-
89
-
90
-
91
-
92
-
93
-
94
-
95
-
96
-
97
-
98
-
99
-
100
-
101
-
102
-
103
-
104
-
 105
105 -
 106
106 -
 107
107 -
 108
108 -
 109
109 -
 110
110 -
 111
111 -
 112
112 -
 113
113 -
 114
114 -
 115
115 -
 116
116 -
 117
117 -
 118
118 -
 119
119 -
 120
120 -
 121
121 -
 122
122 -
 123
123 -
 124
124 -
 125
125 -
126
-
127
-
128
-
129
-
130
-
131
-
132
-
133
-
134
-
135
-
136
-
137
-
138
-
139
-
140
-
141
-
142
-
143
-
144
-
145
-
146
-
147
-
148
-
149
-
150
-
151
-
152
-
153
-
154
-
155
-
156
-
157
-
158
-
159
-
160
-
161
-
162
-
163
-
164
-
165
-
166
-
167
-
168
-
169
-
170
-
171
-
172
-
173
-
174
-
175
-
176
-
177
-
178
-
179
-
180
-
181
-
182
-
183
-
184
-
185
-
186
-
187
-
188
-
189
-
190
-
191
-
192
-
193
-
194
-
195
-
196
-
197
-
198
-
199
-
200
-
201
-
202
-
203
-
204
-
205
-
206
-
207
-
208
-
209
-
210
-
211
-
212
-
213
-
214
-
215
-
216
-
217
-
218
-
219
-
220
 |
 |

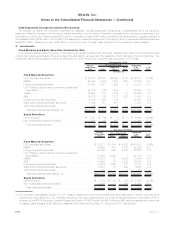
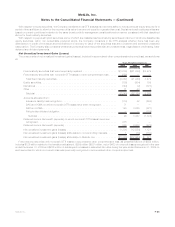
included based on final ratings from the revised NAIC rating methodology which became effective December 31, 2009 (which may not
correspond to rating agency designations).
Collateralized mortgage obligations are a type of mortgage-backed security structured by dividing the cash flows of mortgages into
separate pools or tranches of risk that create multiple classes of bonds with varying maturities and priority of payments. Pass-through
mortgage-backed securities are a type of asset-backed security that is secured by a mortgage or collection of mortgages. The monthly
mortgage payments from homeowners pass from the originating bank through an intermediary, such as a government agency or investment
bank, which collects the payments, and for a fee, remits or passes these payments through to the holders of the pass-through securities.
Prime residential mortgage lending includes the origination of residential mortgage loans to the most credit-worthy borrowers with high
quality credit profiles. Alternative residential mortgage loans (“Alt-A”) are a classification of mortgage loans where the risk profile of the
borrower falls between prime and sub-prime. Sub-prime mortgage lending is the origination of residential mortgage loans to borrowers with
weak credit profiles. During 2009, there were significant ratings downgrades from investment grade to below investment grade for non-
agency RMBS, both Alt-A and prime RMBS, contributing to the decrease in the percentage of RMBS with a Aaa/AAA rating to 80.9% at
December 31, 2009 as compared to 92.3% at December 31, 2008, and a decrease in RMBS with a rating of NAIC 1 to 87.4% at
December 31, 2009 as compared to 95.8% at December 31, 2008. These downgrades also contributed to the substantial decrease
presented below in the Company’s Alt-A securities holdings rated Aa/AA or better or rated NAIC 1 as compared to December 31, 2008.
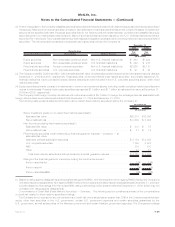
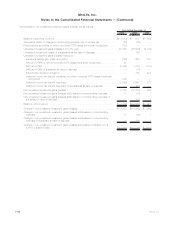
The following table presents the Company’s investment in Alt-A RMBS by vintage year (vintage year refers to the year of origination and not
to the year of purchase) and certain other selected data:
Estimated
Fair
Value %of
Total
Estimated
Fair
Value %of
Total
2009 2008
December 31,
(In millions)
Vintage Year:
2004 & Prior . . . . . . . . . . . . . . . . . . . . . . . . . . . . . . . . . . . . . . . . . . . . $ 109 2.8% $ 250 7.4%
2005 . . . . . . . . . . . . . . . . . . . . . . . . . . . . . . . . . . . . . . . . . . . . . . . . . 1,395 35.7 1,493 44.4
2006 . . . . . . . . . . . . . . . . . . . . . . . . . . . . . . . . . . . . . . . . . . . . . . . . . 825 21.1 857 25.5
2007 . . . . . . . . . . . . . . . . . . . . . . . . . . . . . . . . . . . . . . . . . . . . . . . . . 814 20.8 765 22.7
2008 . . . . . . . . . . . . . . . . . . . . . . . . . . . . . . . . . . . . . . . . . . . . . . . . . — — — —
2009 . . . . . . . . . . . . . . . . . . . . . . . . . . . . . . . . . . . . . . . . . . . . . . . . . 768 19.6 — —
Total . . . . . . . . . . . . . . . . . . . . . . . . . . . . . . . . . . . . . . . . . . . . . . . . . $3,911 100.0% $3,365 100.0%
Amount %of
Total Amount %of
Total
2009 2008
December 31,
(In millions)
Netunrealizedloss......................................... $1,248 $1,951
RatedAa/AAorbetter(1) ..................................... 26.3% 63.4%
RatedNAIC1(2)........................................... 31.3 66.7
Fixedrate ............................................... 89.3 87.9
HybridARM.............................................. 10.7 12.1
Total Alt-A RMBS . . . . . . . . . . . . . . . . . . . . . . . . . . . . . . . . . . . . . . . . . . 100.0% 100.0%
(1) Based on rating agency designations, without adjustment for the revised NAIC methodology which became effective December 31,
2009.
(2) Based on rating agency designations and equivalent ratings of the NAIC, with the exception of non-agency RMBS held by the Company’s
domestic insurance subsidiaries. Non-agency RMBS held by the Company’s domestic insurance subsidiaries at December 31, 2009 are
included based on final ratings from the revised NAIC rating methodology which became effective December 31, 2009 (which may not
correspond to rating agency designations).
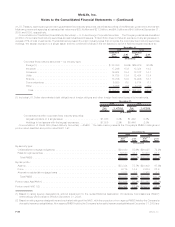
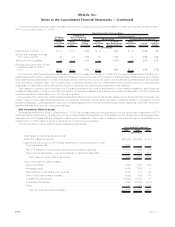
Concentrations of Credit Risk (Fixed Maturity Securities) — CMBS. The Company’s holdings in CMBS were $15.6 billion and $12.6 bil-
lion at estimated fair value at December 31, 2009 and 2008, respectively. The Company had no exposure to CMBS index securities and
holdings of commercial real estate collateralized debt obligations securities had an estimated fair value of $111 million and $121 million at
December 31, 2009 and 2008, respectively.
F-31MetLife, Inc.
MetLife, Inc.
Notes to the Consolidated Financial Statements — (Continued)