MetLife 2009 Annual Report Download - page 23
Download and view the complete annual report
Please find page 23 of the 2009 MetLife annual report below. You can navigate through the pages in the report by either clicking on the pages listed below, or by using the keyword search tool below to find specific information within the annual report.-
 1
1 -
2
-
3
-
4
-
5
-
6
-
7
-
8
-
9
-
10
-
11
-
12
-
 13
13 -
 14
14 -
 15
15 -
 16
16 -
 17
17 -
 18
18 -
 19
19 -
 20
20 -
 21
21 -
 22
22 -
 23
23 -
 24
24 -
 25
25 -
 26
26 -
 27
27 -
 28
28 -
 29
29 -
 30
30 -
 31
31 -
 32
32 -
 33
33 -
34
-
35
-
36
-
37
-
38
-
39
-
40
-
41
-
42
-
43
-
44
-
45
-
46
-
47
-
48
-
49
-
50
-
51
-
52
-
53
-
54
-
55
-
56
-
57
-
58
-
59
-
60
-
61
-
62
-
63
-
64
-
65
-
66
-
67
-
68
-
69
-
70
-
71
-
72
-
73
-
74
-
75
-
76
-
77
-
78
-
79
-
80
-
81
-
82
-
83
-
84
-
85
-
86
-
87
-
88
-
89
-
90
-
91
-
92
-
93
-
94
-
95
-
96
-
97
-
98
-
99
-
100
-
101
-
102
-
103
-
104
-
105
-
106
-
107
-
108
-
109
-
110
-
111
-
112
-
113
-
114
-
115
-
116
-
117
-
118
-
119
-
120
-
121
-
122
-
123
-
124
-
125
-
126
-
127
-
128
-
129
-
130
-
131
-
132
-
133
-
134
-
135
-
136
-
137
-
138
-
139
-
140
-
141
-
142
-
143
-
144
-
145
-
146
-
147
-
148
-
149
-
150
-
151
-
152
-
153
-
154
-
155
-
156
-
157
-
158
-
159
-
160
-
161
-
162
-
163
-
164
-
165
-
166
-
167
-
168
-
169
-
170
-
171
-
172
-
173
-
174
-
175
-
176
-
177
-
178
-
179
-
180
-
181
-
182
-
183
-
184
-
185
-
186
-
187
-
188
-
189
-
190
-
191
-
192
-
193
-
194
-
195
-
196
-
197
-
198
-
199
-
200
-
201
-
202
-
203
-
204
-
205
-
206
-
207
-
208
-
209
-
210
-
211
-
212
-
213
-
214
-
215
-
216
-
217
-
218
-
219
-
220
 |
 |

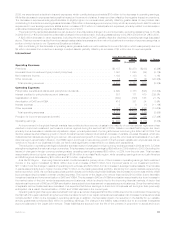
The composition of the investment portfolio of each business segment is tailored to the unique characteristics of its insurance liabilities,
causing certain portfolios to be shorter in duration and others to be longer in duration. Accordingly, certain portfolios are more heavily
weighted in fixed maturity securities, or certain sub-sectors of fixed maturity securities, than other portfolios.
Investments are purchased to support our insurance liabilities and not to generate net investment gains and losses. However, net
investment gains and losses are generated and can change significantly from period to period, due to changes in external influences including
movements in interest rates, foreign currencies and credit spreads, counterparty specific factors such as financial performance, credit rating
and collateral valuation, and internal factors such as portfolio rebalancing that can generate gains and losses. As an investor in the fixed
income, equity security, mortgage loan and certain other invested asset classes, we are exposed to the above stated risks, which can lead to
both impairments and credit-related losses.
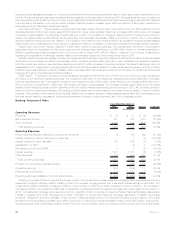
The unfavorable variance in net investment gains (losses) of $5.2 billion, net of related adjustments, was primarily driven by losses on
freestanding derivatives, partially offset by gains on embedded derivatives associated with variable annuity minimum benefit guarantees, and
decreased losses on fixed maturity securities. The negative change in freestanding derivatives, from gains in the prior year to losses in the
current year, was primarily attributable to the effect of rising interest rates on certain interest rate sensitive derivatives that are economic
hedges of certain invested assets and insurance liabilities; weakening U.S. Dollar on certain foreign currency sensitive derivatives, and equity
market and interest rate derivatives that are economic hedges of embedded derivatives. Losses on embedded derivatives decreased from
losses to gains and were driven primarily by rising interest rates and improving equity market performance. The gains were net of losses
attributable to a narrowing of the Company’s own credit spread. Losses on the freestanding derivatives hedging these embedded derivatives
risks substantially offset the change in the liabilities attributable to market factors, excluding the adjustment for the change in the Company’s
own credit spread, which is not hedged. The decrease in losses on fixed maturity securities is primarily attributable to lower net losses on
sales of fixed maturity securities, partially offset by increased impairments due to the current financial market conditions, although this trend
lessened in the latter part of 2009.
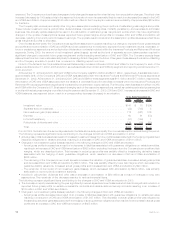
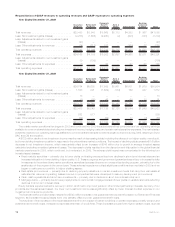
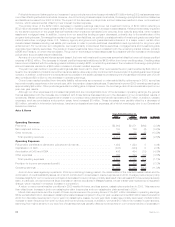
As more fully described in the discussion of performance measures above, operating earnings is the measure of segment profit or loss we
use to evaluate performance and allocate resources. Consistent with GAAP accounting guidance for segment reporting, it is our measure of
performance, as reported below. Operating earnings is not determined in accordance with GAAP and should not be viewed as a substitute for
GAAP income (loss) from continuing operations, net of income tax. We believe that the presentation of operating earnings enhances the
understanding of our performance by highlighting the results of operations and the underlying profitability drivers of the business. Operating
earnings available to common shareholders decreased by $329 million to $2.4 billion in 2009 from $2.7 billion in 2008.
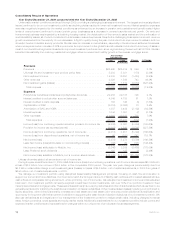
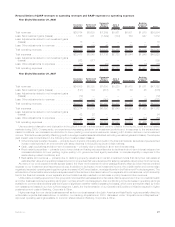
Reconciliation of income (loss) from continuing operations, net of income tax, to operating earnings available to com-
mon shareholders
Year Ended December 31, 2009
Insurance
Products Retirement
Products
Corporate
Benefit
Funding Auto &
Home International
Banking
Corporate
&Other Total
(In millions)
Income (loss) from continuing operations, net of
income tax . . . . . . . . . . . . . . . . . . . . . . . . . . . $ (418) $ (367) $ (841) $321 $(280) $(733) $(2,318)
Less: Net investment gains (losses) . . . . . . . . . . . . . (2,258) (1,606) (2,260) (2) (903) (743) (7,772)
Less: Other adjustments to continuing operations . . . (139) 522 123 — (206) (16) 284
Less: Provision for income tax (expense) benefit . . . . 837 380 745 1 366 354 2,683
Operatingearnings ....................... $1,142 $ 337 $ 551 $322 $463 (328) 2,487
Less:Preferredstockdividends ............... 122 122
Operating earnings available to common
shareholders.......................... $(450) $2,365
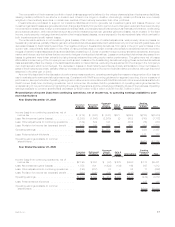
Year Ended December 31, 2008
Insurance
Products Retirement
Products
Corporate
Benefit
Funding Auto &
Home International
Banking
Corporate
& Other Total
(In millions)
Income (loss) from continuing operations, net of
incometax............................ $2,195 $382 $ (97) $275 $553 $173 $3,481
Less: Net investment gains (losses) . . . . . . . . . . . . . 1,558 901 (1,629) (134) 169 947 1,812
Less: Other adjustments to continuing operations . . . . (193) (612) 74 — 52 17 (662)
Less: Provision for income tax (expense) benefit . . . . . (480) (100) 545 46 (147) (352) (488)
Operatingearnings........................ $1,310 $193 $ 913 $363 $479 (439) 2,819
Less:Preferredstockdividends ............... 125 125
Operating earnings available to common
shareholders . . . . . . . . . . . . . . . . . . . . . . . . . . $(564) $2,694
17MetLife, Inc.