MetLife 2009 Annual Report Download - page 52
Download and view the complete annual report
Please find page 52 of the 2009 MetLife annual report below. You can navigate through the pages in the report by either clicking on the pages listed below, or by using the keyword search tool below to find specific information within the annual report.-
 1
1 -
2
-
3
-
4
-
5
-
6
-
7
-
8
-
9
-
10
-
11
-
12
-
13
-
14
-
15
-
16
-
17
-
18
-
19
-
20
-
21
-
22
-
23
-
24
-
25
-
26
-
27
-
28
-
29
-
30
-
31
-
32
-
33
-
34
-
35
-
36
-
37
-
38
-
39
-
40
-
41
-
 42
42 -
 43
43 -
 44
44 -
 45
45 -
 46
46 -
 47
47 -
 48
48 -
 49
49 -
 50
50 -
 51
51 -
 52
52 -
 53
53 -
 54
54 -
 55
55 -
 56
56 -
 57
57 -
 58
58 -
 59
59 -
 60
60 -
 61
61 -
 62
62 -
63
-
64
-
65
-
66
-
67
-
68
-
69
-
70
-
71
-
72
-
73
-
74
-
75
-
76
-
77
-
78
-
79
-
80
-
81
-
82
-
83
-
84
-
85
-
86
-
87
-
88
-
89
-
90
-
91
-
92
-
93
-
94
-
95
-
96
-
97
-
98
-
99
-
100
-
101
-
102
-
103
-
104
-
105
-
106
-
107
-
108
-
109
-
110
-
111
-
112
-
113
-
114
-
115
-
116
-
117
-
118
-
119
-
120
-
121
-
122
-
123
-
124
-
125
-
126
-
127
-
128
-
129
-
130
-
131
-
132
-
133
-
134
-
135
-
136
-
137
-
138
-
139
-
140
-
141
-
142
-
143
-
144
-
145
-
146
-
147
-
148
-
149
-
150
-
151
-
152
-
153
-
154
-
155
-
156
-
157
-
158
-
159
-
160
-
161
-
162
-
163
-
164
-
165
-
166
-
167
-
168
-
169
-
170
-
171
-
172
-
173
-
174
-
175
-
176
-
177
-
178
-
179
-
180
-
181
-
182
-
183
-
184
-
185
-
186
-
187
-
188
-
189
-
190
-
191
-
192
-
193
-
194
-
195
-
196
-
197
-
198
-
199
-
200
-
201
-
202
-
203
-
204
-
205
-
206
-
207
-
208
-
209
-
210
-
211
-
212
-
213
-
214
-
215
-
216
-
217
-
218
-
219
-
220
 |
 |

than 100% indicates that the loan amount is greater than the collateral value. A loan-to-value ratio of less than 100% indicates an excess of
collateral value over the loan amount. The debt service coverage ratio compares a property’s net operating income to amounts needed to
service the principal and interest due under the loan. For commercial loans, at December 31, 2009, the average loan-to-value ratio was 68%,
as compared to 58% at December 31, 2008, and the average debt service coverage ratio was 2.2x, as compared to 1.8x at December 31,
2008. The values utilized in calculating these ratios are developed in connection with our review of the commercial loan portfolio, and are
updated routinely, including a periodic quality rating process and an evaluation of the estimated fair value of the underlying collateral.
Mortgage Loan Credit Quality — Monitoring Process — Residential and Consumer Loans. The Company has a conservative residential
and consumer loan portfolio and does not hold any option ARMs, sub-prime, low teaser rate, or loans with a loan-to-value ratio of 100% or
more. Higher risk loans include those that are classified as restructured, potentially delinquent, delinquent or in foreclosure, as well as loans
with higher loan-to-value ratios and interest-only loans. The Company’s investment in residential junior lien loans and residential loans with a
loan-to-value ratio of 80% or more was $76 million at December 31, 2009, and the majority of the higher loan-to-value loans have mortgage
insurance coverage which reduces the loan-to-value ratio to less than 80%. Additionally, the Company’s investment in traditional residential
interest-only loans was $323 million at December 31, 2009.
Mortgage Loans Valuation Allowances. Recent economic events causing deteriorating market conditions, low levels of liquidity and
credit spread widening have all adversely impacted the mortgage loan markets. As a result, commercial real estate and residential and
consumer loan market fundamentals, and fundamentals in certain sectors of the agricultural loan market, have weakened. The Company
expects continued pressure on these fundamentals, including but not limited to declining rent growth, increased vacancies, rising
delinquencies and declining property values. These deteriorating factors have been considered in the Company’s ongoing, systematic
and comprehensive review of the commercial, agricultural and residential and consumer mortgage loan portfolios, resulting in higher
impairments and valuation allowances for the year ended December 31, 2009 as compared to the prior periods.
The Company’s valuation allowances are established both on a loan specific basis for those loans considered impaired where a property
specific or market specific risk has been identified that could likely result in a future loss, as well as for pools of loans with similar risk
characteristics where a property specific or market specific risk has not been identified, but for which the Company expects to incur a loss.
Accordingly, a valuation allowance is provided to absorb these estimated probable credit losses. The Company records valuation allowances
and gains and losses from the sale of loans in net investment gains (losses).
The Company records valuation allowances for loans considered to be impaired when it is probable that, based upon current information
and events, the Company will be unable to collect all amounts due under the contractual terms of the loan agreement. Based on the facts and
circumstances of the individual loans being impaired, loan specific valuation allowances are established for the excess carrying value of the
loan over either: (i) the present value of expected future cash flows discounted at the loan’s original effective interest rate; (ii) the estimated fair
value of the loan’s underlying collateral if the loan is in the process of foreclosure or otherwise collateral dependent; or (iii) the loan’s
observable market price.
The Company also establishes valuation allowances for loan losses for pools of loans with similar characteristics, such as loans based on
similar property types or loans with similar loan-to-value or similar debt service coverage ratio factors when, based on past experience, it is
probable that a credit event has occurred and the amount of loss can be reasonably estimated.
The determination of the amount of, and additions to, valuation allowances is based upon the Company’s periodic evaluation and
assessment of known and inherent risks associated with its loan portfolios. Such evaluations and assessments are based upon several
factors, including the Company’s experience for loan losses, defaults and loss severity, and loss expectations for loans with similar risk
characteristics. These evaluations and assessments are revised as conditions change and new information becomes available. We update
our evaluations regularly, which can cause the valuation allowances to increase or decrease over time as such evaluations are revised, and
such changes in the valuation allowance are also recorded in net investment gains (losses).
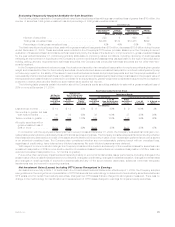
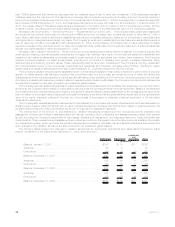
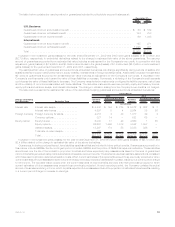
The following tables present the changes in valuation allowances for commercial, agricultural and residential and consumer loans
held-for-investment for the years ended December 31, 2009, 2008 and 2007:
Commercial Agricultural
Residential
and
Consumer Total
(In millions)
Balance, January 1, 2007 . . . . . . . . . . . . . . . . . . . . . . . . . . . . . $153 $ 18 $11 $182
Additions........................................ 68 8 — 76
Deductions ...................................... (54) (2) (5) (61)
Balance, December 31, 2007 . . . . . . . . . . . . . . . . . . . . . . . . . . 167 24 6 197
Additions........................................ 145 49 6 200
Deductions ...................................... (80) (12) (1) (93)
Balance, December 31, 2008 . . . . . . . . . . . . . . . . . . . . . . . . . . 232 61 11 304
Additions........................................ 384 79 12 475
Deductions ...................................... (27) (25) (6) (58)
Balance, December 31, 2009 . . . . . . . . . . . . . . . . . . . . . . . . . . $589 $115 $17 $721
46 MetLife, Inc.