MetLife 2009 Annual Report Download - page 25
Download and view the complete annual report
Please find page 25 of the 2009 MetLife annual report below. You can navigate through the pages in the report by either clicking on the pages listed below, or by using the keyword search tool below to find specific information within the annual report.-
 1
1 -
2
-
3
-
4
-
5
-
6
-
7
-
8
-
9
-
10
-
11
-
12
-
13
-
14
-
 15
15 -
 16
16 -
 17
17 -
 18
18 -
 19
19 -
 20
20 -
 21
21 -
 22
22 -
 23
23 -
 24
24 -
 25
25 -
 26
26 -
 27
27 -
 28
28 -
 29
29 -
 30
30 -
 31
31 -
 32
32 -
 33
33 -
 34
34 -
 35
35 -
36
-
37
-
38
-
39
-
40
-
41
-
42
-
43
-
44
-
45
-
46
-
47
-
48
-
49
-
50
-
51
-
52
-
53
-
54
-
55
-
56
-
57
-
58
-
59
-
60
-
61
-
62
-
63
-
64
-
65
-
66
-
67
-
68
-
69
-
70
-
71
-
72
-
73
-
74
-
75
-
76
-
77
-
78
-
79
-
80
-
81
-
82
-
83
-
84
-
85
-
86
-
87
-
88
-
89
-
90
-
91
-
92
-
93
-
94
-
95
-
96
-
97
-
98
-
99
-
100
-
101
-
102
-
103
-
104
-
105
-
106
-
107
-
108
-
109
-
110
-
111
-
112
-
113
-
114
-
115
-
116
-
117
-
118
-
119
-
120
-
121
-
122
-
123
-
124
-
125
-
126
-
127
-
128
-
129
-
130
-
131
-
132
-
133
-
134
-
135
-
136
-
137
-
138
-
139
-
140
-
141
-
142
-
143
-
144
-
145
-
146
-
147
-
148
-
149
-
150
-
151
-
152
-
153
-
154
-
155
-
156
-
157
-
158
-
159
-
160
-
161
-
162
-
163
-
164
-
165
-
166
-
167
-
168
-
169
-
170
-
171
-
172
-
173
-
174
-
175
-
176
-
177
-
178
-
179
-
180
-
181
-
182
-
183
-
184
-
185
-
186
-
187
-
188
-
189
-
190
-
191
-
192
-
193
-
194
-
195
-
196
-
197
-
198
-
199
-
200
-
201
-
202
-
203
-
204
-
205
-
206
-
207
-
208
-
209
-
210
-
211
-
212
-
213
-
214
-
215
-
216
-
217
-
218
-
219
-
220
 |
 |

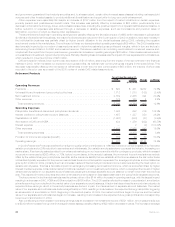
commissions and premium taxes, some of which have been capitalized, more than offset the favorable impact of lower information
technology, travel, professional services and advertising expenses, which include the impact of our Operational Excellence initiative.
The market improvement which began in the second quarter of 2009 was a key factor in the determination of our expected future gross
profits, the increase of which triggered a decrease in DAC and DSI amortization, most significantly in the Retirement Products segment. The
increase in our expected future gross profits stemmed primarily from an increase in the market value of our separate account balances, which
is attributable, in part, to the improving financial markets. Our Insurance Products segment benefited, in the current year, from an increase in
amortization of unearned revenue, primarily as a result of our annual review of assumptions that are used in the determination of the amount of
amortization recognized. These collective changes in amortization resulted in a $720 million benefit, partially offsetting the declines in
operating earnings available to common shareholders discussed above.
A portion of the decline in operating earnings available to common shareholders was caused by a $200 million reduction in the results of
our closed block of business, a specific group of participating life policies that were segregated in connection with the demutualization of
MLIC. Until early 2009, the operating earnings of the closed block did not have a full impact on operating earnings as the operating earnings or
loss was partially offset by a change in the policyholder dividend obligation, a liability established at the time of demutualization. However, in
early 2009 the policyholder dividend obligation was depleted and, as a result, the total operating earnings or loss related to the closed block
for the year ended December 31, 2009 was, and in the future may be a component of operating earnings.
Business growth, from the majority of our businesses, along with net favorable mortality experience, had a positive impact on operating
earnings available to common shareholders. These impacts were somewhat dampened by higher benefit utilization in our dental business and
mixed claim activity in our Auto & Home segment. In addition, our forward and reverse residential mortgage platform acquisitions in late 2008
benefited Banking, Corporate & Other’s 2009 results.
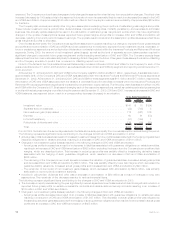
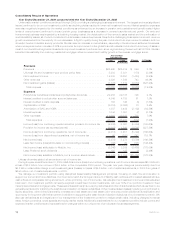
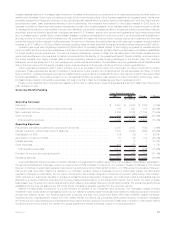
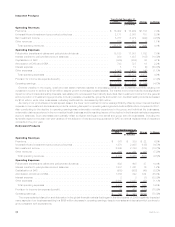
Insurance Products
2009 2008 Change % Change
Years Ended December 31,
(In millions)
Operating Revenues
Premiums.................................................... $17,168 $16,402 $766 4.7%
Universallifeandinvestment-typeproductpolicyfees ....................... 2,281 2,171 110 5.1%
Netinvestmentincome ........................................... 5,614 5,787 (173) (3.0)%
Otherrevenues ................................................ 779 819 (40) (4.9)%
Totaloperatingrevenues......................................... 25,842 25,179 663 2.6%
Operating Expenses
Policyholder benefits and claims and policyholder dividends . . . . . . . . . . . . . . . . . . . 19,111 18,183 928 5.1%
Interestcreditedtopolicyholderaccountbalances.......................... 952 930 22 2.4%
CapitalizationofDAC............................................. (873) (849) (24) (2.8)%
AmortizationofDACandVOBA ...................................... 725 743 (18) (2.4)%
Interestexpense................................................ 6 5 1 20.0%
Otherexpenses................................................ 4,206 4,196 10 0.2%
Totaloperatingexpenses......................................... 24,127 23,208 919 4.0%
Provisionforincometaxexpense(benefit)............................... 573 661 (88) (13.3)%
Operating earnings . . . . . . . . . . . . . . . . . . . . . . . . . . . . . . . . . . . . . . . . . . . . . . $ 1,142 $ 1,310 $(168) (12.8)%
Unfavorable market conditions, which continued through 2009, provided a challenging business environment for our Insurance Products
segment. This resulted in lower net investment income and an increase in market sensitive expenses, primarily pension and postretirement
benefit costs. We also experienced higher utilization of dental benefits along with a lower number of recoveries in our disability business.
Higher levels of unemployment continued to impact certain group businesses as a decrease in covered payrolls reduced growth. However,
revenue growth remained solid in all of our businesses. Revenue growth in our dental and individual life businesses reflected strong sales and
renewals.
The significant components of the $168 million decline in operating earnings were the aforementioned decline in net investment income,
especially in the closed block business, partially offset by an increase in the amortization of unearned revenue, the impact of a reduction in
dividends to certain policyholders and favorable mortality in the individual life business.
Until early 2009, the earnings of the closed block did not have a full impact on operating earnings as the earnings or loss was partially offset
by a change in the policyholder dividend obligation. However, in early 2009 the policyholder dividend obligation was depleted and, as a result,
the total operating earnings or loss related to the closed block for the year ended December 31, 2009 was, and in the future may be, a
component of operating earnings. This resulted in a $200 million decline in operating earnings in 2009.
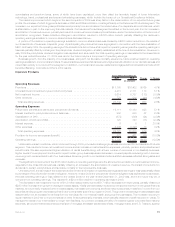
The decrease in net investment income of $112 million was primarily due to a $317 million decrease from lower yields, partially offset by a
$205 million increase from growth in average invested assets. Yields were adversely impacted by the severe downturn in the global financial
markets, which primarily impacted other invested assets, real estate joint ventures and fixed maturity securities. In addition, income from our
securities lending program decreased primarily due to the smaller size of the program in 2009. The growth in the average invested asset base
was primarily from an increase in net flows from our individual life, non-medical health, and group life businesses. The moderate recovery in
equity markets in 2009 led to improved yields on other limited partnership interests, which partially offset the overall reduction in yields. To
manage the needs of our intermediate to longer-term liabilities, our portfolio consists primarily of investment grade corporate fixed maturity
securities, structured finance securities (comprised of mortgage and asset-backed securities), mortgage loans, and U.S. Treasury, agency
19MetLife, Inc.