MetLife 2009 Annual Report Download - page 112
Download and view the complete annual report
Please find page 112 of the 2009 MetLife annual report below. You can navigate through the pages in the report by either clicking on the pages listed below, or by using the keyword search tool below to find specific information within the annual report.-
 1
1 -
2
-
3
-
4
-
5
-
6
-
7
-
8
-
9
-
10
-
11
-
12
-
13
-
14
-
15
-
16
-
17
-
18
-
19
-
20
-
21
-
22
-
23
-
24
-
25
-
26
-
27
-
28
-
29
-
30
-
31
-
32
-
33
-
34
-
35
-
36
-
37
-
38
-
39
-
40
-
41
-
42
-
43
-
44
-
45
-
46
-
47
-
48
-
49
-
50
-
51
-
52
-
53
-
54
-
55
-
56
-
57
-
58
-
59
-
60
-
61
-
62
-
63
-
64
-
65
-
66
-
67
-
68
-
69
-
70
-
71
-
72
-
73
-
74
-
75
-
76
-
77
-
78
-
79
-
80
-
81
-
82
-
83
-
84
-
85
-
86
-
87
-
88
-
89
-
90
-
91
-
92
-
93
-
94
-
95
-
96
-
97
-
98
-
99
-
100
-
101
-
 102
102 -
 103
103 -
 104
104 -
 105
105 -
 106
106 -
 107
107 -
 108
108 -
 109
109 -
 110
110 -
 111
111 -
 112
112 -
 113
113 -
 114
114 -
 115
115 -
 116
116 -
 117
117 -
 118
118 -
 119
119 -
 120
120 -
 121
121 -
 122
122 -
123
-
124
-
125
-
126
-
127
-
128
-
129
-
130
-
131
-
132
-
133
-
134
-
135
-
136
-
137
-
138
-
139
-
140
-
141
-
142
-
143
-
144
-
145
-
146
-
147
-
148
-
149
-
150
-
151
-
152
-
153
-
154
-
155
-
156
-
157
-
158
-
159
-
160
-
161
-
162
-
163
-
164
-
165
-
166
-
167
-
168
-
169
-
170
-
171
-
172
-
173
-
174
-
175
-
176
-
177
-
178
-
179
-
180
-
181
-
182
-
183
-
184
-
185
-
186
-
187
-
188
-
189
-
190
-
191
-
192
-
193
-
194
-
195
-
196
-
197
-
198
-
199
-
200
-
201
-
202
-
203
-
204
-
205
-
206
-
207
-
208
-
209
-
210
-
211
-
212
-
213
-
214
-
215
-
216
-
217
-
218
-
219
-
220
 |
 |

2009 Disposition through Assumption Reinsurance
On October 30, 2009, the Company completed the disposal, through assumption reinsurance, of substantially all of the insurance
business of MetLife Canada, a wholly-owned indirect subsidiary, to a third-party. Pursuant to the assumption reinsurance agreement, the
consideration paid by the Company was $259 million, comprised of cash of $14 million and fixed maturity securities, mortgage loans and
other assets totaling $245 million. At the date of the assumption reinsurance agreement, the carrying value of insurance liabilities transferred
was $267 million, resulting in a gain of $5 million, net of income tax. The gain was recognized in net investment gains (losses).
3. Investments
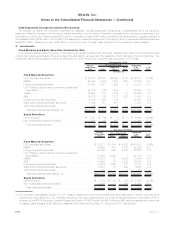
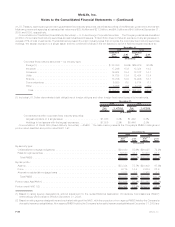
Fixed Maturity and Equity Securities Available-for-Sale
The following tables present the cost or amortized cost, gross unrealized gain and loss, estimated fair value of the Company’s fixed
maturity and equity securities and the percentage that each sector represents by the respective total holdings for the periods shown. The
unrealized loss amounts presented below at December 31, 2009 include the noncredit loss component of OTTI loss:
Cost or
Amortized
Cost Gain Temporary
Loss OTTI
Loss
Estimated
Fair
Value %of
Total
Gross Unrealized
December 31, 2009
(In millions)
Fixed Maturity Securities:
U.S. corporate securities . . . . . . . . . . . . . . . . . . . . $ 72,075 $2,821 $2,699 $ 10 $ 72,187 31.7%
RMBS ................................ 45,343 1,234 1,957 600 44,020 19.3
Foreign corporate securities . . . . . . . . . . . . . . . . . . 37,254 2,011 1,226 9 38,030 16.7
U.S. Treasury, agency and government guaranteed
securities(1) ........................... 25,712 745 1,010 — 25,447 11.2
CMBS ................................ 16,555 191 1,106 18 15,622 6.9
ABS.................................. 14,272 189 1,077 222 13,162 5.8
Foreign government securities . . . . . . . . . . . . . . . . . 11,010 1,076 139 — 11,947 5.2
State and political subdivision securities . . . . . . . . . . 7,468 151 411 — 7,208 3.2
Otherfixedmaturitysecurities................. 20 1 2 — 19 —
Total fixed maturity securities(2), (3) . . . . . . . . . . . . $229,709 $8,419 $9,627 $859 $227,642 100.0%
Equity Securities:
Commonstock........................... $ 1,537 $ 92 $ 8 $ — $ 1,621 52.6%
Non-redeemable preferred stock(2) . . . . . . . . . . . . . . 1,650 80 267 — 1,463 47.4
Total equity securities(4) . . . . . . . . . . . . . . . . . . . $ 3,187 $ 172 $ 275 $ — $ 3,084 100.0%
Cost or
Amortized
Cost Gain Loss
Estimated
Fair
Value %of
Total
Gross Unrealized
December 31, 2008
(In millions)
Fixed Maturity Securities:
U.S.corporatesecurities .......................... $ 72,211 $ 994 $ 9,902 $ 63,303 33.6%
RMBS ...................................... 39,995 753 4,720 36,028 19.2
Foreign corporate securities . . . . . . . . . . . . . . . . . . . . . . . . 34,798 565 5,684 29,679 15.8
U.S. Treasury, agency and government guaranteed
securities(1) ................................. 17,229 4,082 1 21,310 11.3
CMBS ...................................... 16,079 18 3,453 12,644 6.7
ABS........................................ 14,246 16 3,739 10,523 5.6
Foreign government securities . . . . . . . . . . . . . . . . . . . . . . . 9,474 1,056 377 10,153 5.4
State and political subdivision securities . . . . . . . . . . . . . . . . 5,419 80 942 4,557 2.4
Otherfixedmaturitysecurities....................... 57 — 3 54 —
Total fixed maturity securities(2), (3) . . . . . . . . . . . . . . . . . . $209,508 $7,564 $28,821 $188,251 100.0%
Equity Securities:
Commonstock ................................ $ 1,778 $ 40 $ 133 $ 1,685 52.7%
Non-redeemable preferred stock(2) . . . . . . . . . . . . . . . . . . . 2,353 4 845 1,512 47.3
Total equity securities(4) . . . . . . . . . . . . . . . . . . . . . . . . . $ 4,131 $ 44 $ 978 $ 3,197 100.0%
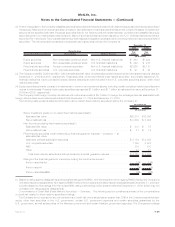
(1) The Company has classified within the U.S. Treasury, agency and government guaranteed securities caption certain corporate fixed
maturity securities issued by U.S. financial institutions that were guaranteed by the Federal Deposit Insurance Corporation (“FDIC”)
pursuant to the FDIC’s Temporary Liquidity Guarantee Program (“FDIC Program”) of $407 million and $2 million at estimated fair value with
unrealized gains (losses) of $2 million and less than ($1) million at December 31, 2009 and 2008, respectively.
F-28 MetLife, Inc.
MetLife, Inc.
Notes to the Consolidated Financial Statements — (Continued)