MetLife 2009 Annual Report Download - page 22
Download and view the complete annual report
Please find page 22 of the 2009 MetLife annual report below. You can navigate through the pages in the report by either clicking on the pages listed below, or by using the keyword search tool below to find specific information within the annual report.-
 1
1 -
2
-
3
-
4
-
5
-
6
-
7
-
8
-
9
-
10
-
11
-
 12
12 -
 13
13 -
 14
14 -
 15
15 -
 16
16 -
 17
17 -
 18
18 -
 19
19 -
 20
20 -
 21
21 -
 22
22 -
 23
23 -
 24
24 -
 25
25 -
 26
26 -
 27
27 -
 28
28 -
 29
29 -
 30
30 -
 31
31 -
 32
32 -
33
-
34
-
35
-
36
-
37
-
38
-
39
-
40
-
41
-
42
-
43
-
44
-
45
-
46
-
47
-
48
-
49
-
50
-
51
-
52
-
53
-
54
-
55
-
56
-
57
-
58
-
59
-
60
-
61
-
62
-
63
-
64
-
65
-
66
-
67
-
68
-
69
-
70
-
71
-
72
-
73
-
74
-
75
-
76
-
77
-
78
-
79
-
80
-
81
-
82
-
83
-
84
-
85
-
86
-
87
-
88
-
89
-
90
-
91
-
92
-
93
-
94
-
95
-
96
-
97
-
98
-
99
-
100
-
101
-
102
-
103
-
104
-
105
-
106
-
107
-
108
-
109
-
110
-
111
-
112
-
113
-
114
-
115
-
116
-
117
-
118
-
119
-
120
-
121
-
122
-
123
-
124
-
125
-
126
-
127
-
128
-
129
-
130
-
131
-
132
-
133
-
134
-
135
-
136
-
137
-
138
-
139
-
140
-
141
-
142
-
143
-
144
-
145
-
146
-
147
-
148
-
149
-
150
-
151
-
152
-
153
-
154
-
155
-
156
-
157
-
158
-
159
-
160
-
161
-
162
-
163
-
164
-
165
-
166
-
167
-
168
-
169
-
170
-
171
-
172
-
173
-
174
-
175
-
176
-
177
-
178
-
179
-
180
-
181
-
182
-
183
-
184
-
185
-
186
-
187
-
188
-
189
-
190
-
191
-
192
-
193
-
194
-
195
-
196
-
197
-
198
-
199
-
200
-
201
-
202
-
203
-
204
-
205
-
206
-
207
-
208
-
209
-
210
-
211
-
212
-
213
-
214
-
215
-
216
-
217
-
218
-
219
-
220
 |
 |

Consolidated Results of Operations
Year Ended December 31, 2009 compared with the Year Ended December 31, 2008
Unfavorable market conditions continued through 2009, providing a challenging business environment. The largest and most significant
impact continued to be on our investment portfolio as declining yields resulted in lower net investment income. Market sensitive expenses
were also negatively impacted by the market conditions as evidenced by an increase in pension and postretirement benefit costs. Higher
levels of unemployment continued to impact certain group businesses as a decrease in covered payrolls reduced growth. Our auto and
homeowners business was impacted by a declining housing market, the deterioration of the new auto sales market and the continuation of
credit availability issues, all of which contributed to a decrease in insured exposures. Despite the challenging business environment, revenue
growth remained solid in the majority of our businesses. A flight to quality during the year contributed to an improvement in sales in both our
domestic fixed and variable annuity products. We also saw an increase in market share, especially in the structured settlement business,
where we experienced an increase of 53% in premiums. An improvement in the global financial markets contributed to a recovery of sales in
most of our international regions and resulted in improved investment performance in some regions during the second half of 2009. We also
benefited domestically from a strong residential mortgage refinance market and healthy growth in the reverse mortgage arena.
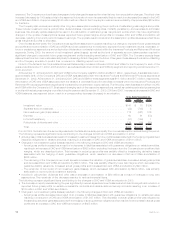
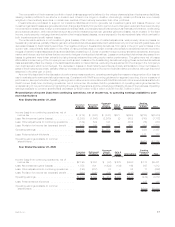
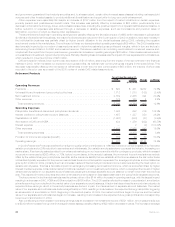
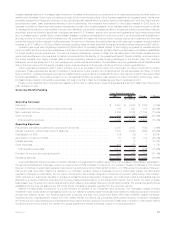
2009 2008 Change % Change
Years Ended
December 31,
(In millions)
Revenues
Premiums ........................................... $26,460 $25,914 $ 546 2.1%
Universal life and investment-type product policy fees . . . . . . . . . . . . . . 5,203 5,381 (178) (3.3)%
Netinvestmentincome................................... 14,838 16,291 (1,453) (8.9)%
Otherrevenues ....................................... 2,329 1,586 743 46.8%
Net investment gains (losses) . . . . . . . . . . . . . . . . . . . . . . . . . . . . . . (7,772) 1,812 (9,584) (528.9)%
Totalrevenues....................................... 41,058 50,984 (9,926) (19.5)%
Expenses
Policyholder benefits and claims and policyholder dividends. . . . . . . . . . . 29,986 29,188 798 2.7%
Interestcreditedtopolicyholderaccountbalances................. 4,849 4,788 61 1.3%
Interestcreditedtobankdeposits............................ 163 166 (3) (1.8)%
CapitalizationofDAC.................................... (3,019) (3,092) 73 2.4%
AmortizationofDACandVOBA ............................. 1,307 3,489 (2,182) (62.5)%
Interestexpense....................................... 1,044 1,051 (7) (0.7)%
Otherexpenses ....................................... 11,061 10,333 728 7.0%
Totalexpenses ...................................... 45,391 45,923 (532) (1.2)%
Income (loss) from continuing operations before provision for income tax . . (4,333) 5,061 (9,394) (185.6)%
Provision for income tax expense (benefit) . . . . . . . . . . . . . . . . . . . . . . (2,015) 1,580 (3,595) (227.5)%
Income (loss) from continuing operations, net of income tax . . . . . . . . . . . (2,318) 3,481 (5,799) (166.6)%
Income (loss) from discontinued operations, net of income tax . . . . . . . . . 40 (203) 243 119.7%
Net income (loss) . . . . . . . . . . . . . . . . . . . . . . . . . . . . . . . . . . . . . . (2,278) 3,278 (5,556) (169.5)%
Less: Net income (loss) attributable to noncontrolling interests . . . . . . . . . (32) 69 (101) (146.4)%
Net income (loss) attributable to MetLife, Inc. . . . . . . . . . . . . . . . . . . . . (2,246) 3,209 (5,455) (170.0)%
Less:Preferredstockdividends............................. 122 125 (3) (2.4)%
Net income (loss) available to MetLife, Inc.’s common shareholders . . . . . . $ (2,368) $ 3,084 $(5,452) (176.8)%
Unless otherwise stated, all amounts are net of income tax.
During the year ended December 31, 2009, MetLife’s income (loss) from continuing operations, net of income tax decreased $5.8 billion to
a loss of $2.3 billion from income of $3.5 billion in the comparable 2008 period. The year over year change is predominantly due to a
$5.2 billion unfavorable change in net investment gains (losses) to losses of $4.6 billion, net of related adjustments, in 2009 from gains of
$644 million, net of related adjustments, in 2008.
We manage our investment portfolio using disciplined Asset/Liability Management principles, focusing on cash flow and duration to
support our current and future liabilities. Our intent is to match the timing and amount of liability cash outflows with invested assets that have
cash inflows of comparable timing and amount, while optimizing, net of income tax, risk-adjusted net investment income and risk-adjusted
total return. Our investment portfolio is heavily weighted toward fixed income investments, with over 80% of our portfolio invested in fixed
maturity securities and mortgage loans. These securities and loans have varying maturities and other characteristics which cause them to be
generally well suited for matching the cash flow and duration of insurance liabilities. Other invested asset classes including, but not limited to
equity securities, other limited partnership interests and real estate and real estate joint ventures provide additional diversification and
opportunity for long term yield enhancement in addition to supporting the cash flow and duration objectives of our investment portfolio. We
also use derivatives as an integral part of our management of the investment portfolio to hedge certain risks, including changes in interest
rates, foreign currencies, credit spreads and equity market levels. Additional considerations for our investment portfolio include current and
expected market conditions and expectations for changes within our unique mix of products and business segments.
16 MetLife, Inc.