MetLife 2009 Annual Report Download - page 72
Download and view the complete annual report
Please find page 72 of the 2009 MetLife annual report below. You can navigate through the pages in the report by either clicking on the pages listed below, or by using the keyword search tool below to find specific information within the annual report.-
 1
1 -
2
-
3
-
4
-
5
-
6
-
7
-
8
-
9
-
10
-
11
-
12
-
13
-
14
-
15
-
16
-
17
-
18
-
19
-
20
-
21
-
22
-
23
-
24
-
25
-
26
-
27
-
28
-
29
-
30
-
31
-
32
-
33
-
34
-
35
-
36
-
37
-
38
-
39
-
40
-
41
-
42
-
43
-
44
-
45
-
46
-
47
-
48
-
49
-
50
-
51
-
52
-
53
-
54
-
55
-
56
-
57
-
58
-
59
-
60
-
61
-
 62
62 -
 63
63 -
 64
64 -
 65
65 -
 66
66 -
 67
67 -
 68
68 -
 69
69 -
 70
70 -
 71
71 -
 72
72 -
 73
73 -
 74
74 -
 75
75 -
 76
76 -
 77
77 -
 78
78 -
 79
79 -
 80
80 -
 81
81 -
 82
82 -
83
-
84
-
85
-
86
-
87
-
88
-
89
-
90
-
91
-
92
-
93
-
94
-
95
-
96
-
97
-
98
-
99
-
100
-
101
-
102
-
103
-
104
-
105
-
106
-
107
-
108
-
109
-
110
-
111
-
112
-
113
-
114
-
115
-
116
-
117
-
118
-
119
-
120
-
121
-
122
-
123
-
124
-
125
-
126
-
127
-
128
-
129
-
130
-
131
-
132
-
133
-
134
-
135
-
136
-
137
-
138
-
139
-
140
-
141
-
142
-
143
-
144
-
145
-
146
-
147
-
148
-
149
-
150
-
151
-
152
-
153
-
154
-
155
-
156
-
157
-
158
-
159
-
160
-
161
-
162
-
163
-
164
-
165
-
166
-
167
-
168
-
169
-
170
-
171
-
172
-
173
-
174
-
175
-
176
-
177
-
178
-
179
-
180
-
181
-
182
-
183
-
184
-
185
-
186
-
187
-
188
-
189
-
190
-
191
-
192
-
193
-
194
-
195
-
196
-
197
-
198
-
199
-
200
-
201
-
202
-
203
-
204
-
205
-
206
-
207
-
208
-
209
-
210
-
211
-
212
-
213
-
214
-
215
-
216
-
217
-
218
-
219
-
220
 |
 |

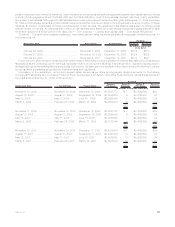
(5) Includes shares of an affiliate distributed to the Holding Company as an in-kind dividend of $164 million.
(6) Includes a return of capital of $404 million as approved by the applicable insurance department, of which $350 million was paid to the
Holding Company.
In the fourth quarter of 2008, MICC declared and paid an ordinary dividend of $500 million to the Holding Company. In the third quarter of
2008, MLIC used its otherwise ordinary dividend capacity through an in-kind dividend in conjunction with the RGA split-off as approved by the
New York Insurance Commissioner.
In addition to the amounts presented in the table above, for the years ended December 31, 2009 and 2008, cash dividends in the amount
of $215 million and $235 million, respectively, were paid to the Holding Company. For the year ended December 31, 2007, $190 million in
dividends were paid to the Holding Company, of which $176 million were returns of capital.
Liquid Assets. An integral part of the Holding Company’s liquidity management is the amount of liquid assets it holds. Liquid assets
include cash, cash equivalents, short-term investments and publicly-traded securities. Liquid assets exclude cash collateral received under
the Company’s securities lending program that has been reinvested in cash, cash equivalents, short-term investments and publicly-traded
securities. At December 31, 2009 and 2008, the Holding Company had $3.8 billion and $2.7 billion in liquid assets, respectively. In addition,
the Holding Company has pledged collateral and has had collateral pledged to it, and may be required from time to time to pledge additional
collateral or be entitled to have additional collateral pledged to it. At December 31, 2009 and 2008, the Holding Company had pledged
$289 million and $820 million, respectively, of liquid assets under collateral support agreements.
Global Funding Sources. Liquidity is also provided by a variety of short-term instruments, including commercial paper. Capital is
provided by a variety of instruments, including medium- and long-term debt, junior subordinated debt securities, collateral financing
arrangements, capital securities and stockholders’ equity. The diversity of the Holding Company’s funding sources enhances funding
flexibility and limits dependence on any one source of funds and generally lowers the cost of funds. Other sources of the Holding Company’s
liquidity include programs for short-and long-term borrowing, as needed.
We continuously monitor and adjust our liquidity and capital plans for the Holding Company and its subsidiaries in light of changing
requirements and market conditions.
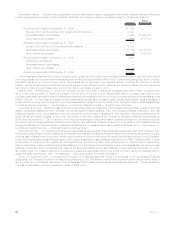
The following table summarizes the amounts outstanding under various types of global funding sources available to the Holding Company
at:
2009 2008
December 31,
(In millions)
Short-termdebt....................................................... $ — $ 300
Long-termdebt—unaffiliated.............................................. $10,458 $7,660
Long-termdebt—affiliated ............................................... $ 500 $ 500
Collateralfinancingarrangements............................................ $ 2,797 $2,692
Juniorsubordinateddebtsecurities .......................................... $ 1,748 $2,315
In November 2007, the Holding Company filed a shelf registration statement (the “2007 Registration Statement”) with the SEC, which was
automatically effective upon filing, in accordance with SEC rules. SEC rules also allow for pay-as-you-go fees and the ability to add securities
by filing automatically effective amendment for companies, such as the Holding Company, which qualify as “Well-Known Seasoned Issuers.”
The 2007 Registration Statement registered an unlimited amount of debt and equity securities and supersedes the shelf registration
statement that the Holding Company filed in April 2005. The terms of any offering will be established at the time of the offering.
Debt Issuances and Other Borrowings. For information on debt issuances and other borrowings entered into by the Holding Company,
see “— The Company — Liquidity and Capital Sources — Debt Issuances and Other Borrowings.”
Collateral Financing Arrangements. For information on collateral financing arrangements entered into by the Holding Company, see
“— The Company — Liquidity and Capital Sources — Collateral Financing Arrangements.”
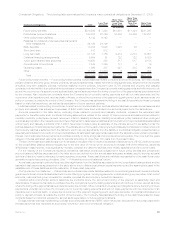
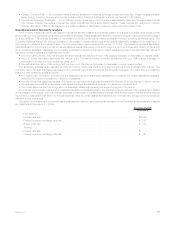
The following table summarizes the Holding Company’s outstanding senior notes series by maturity date, excluding any premium or
discount, at December 31, 2009:
Maturity Date Principal Interest Rate
(In millions)
2011 . . . . . . . . . . . . . . . . . . . . . . . . . . . . . . . . . . . . . . . . . . . . . . . . . $ 750 6.13%
2012 . . . . . . . . . . . . . . . . . . . . . . . . . . . . . . . . . . . . . . . . . . . . . . . . . $ 400 5.38%
2012 . . . . . . . . . . . . . . . . . . . . . . . . . . . . . . . . . . . . . . . . . . . . . . . . . $ 397 3-month LIBOR + .032%
2013 . . . . . . . . . . . . . . . . . . . . . . . . . . . . . . . . . . . . . . . . . . . . . . . . . $ 500 5.00%
2014 . . . . . . . . . . . . . . . . . . . . . . . . . . . . . . . . . . . . . . . . . . . . . . . . . $ 350 5.50%
2015 . . . . . . . . . . . . . . . . . . . . . . . . . . . . . . . . . . . . . . . . . . . . . . . . . $1,000 5.00%
2016 . . . . . . . . . . . . . . . . . . . . . . . . . . . . . . . . . . . . . . . . . . . . . . . . . $1,250 6.75%
2018 . . . . . . . . . . . . . . . . . . . . . . . . . . . . . . . . . . . . . . . . . . . . . . . . . $1,035 6.82%
2019 . . . . . . . . . . . . . . . . . . . . . . . . . . . . . . . . . . . . . . . . . . . . . . . . . $1,035 7.72%
2020 . . . . . . . . . . . . . . . . . . . . . . . . . . . . . . . . . . . . . . . . . . . . . . . . . $ 646 5.25%
2024 . . . . . . . . . . . . . . . . . . . . . . . . . . . . . . . . . . . . . . . . . . . . . . . . . $ 565 5.38%
2032 . . . . . . . . . . . . . . . . . . . . . . . . . . . . . . . . . . . . . . . . . . . . . . . . . $ 600 6.50%
2033 . . . . . . . . . . . . . . . . . . . . . . . . . . . . . . . . . . . . . . . . . . . . . . . . . $ 200 5.88%
2034 . . . . . . . . . . . . . . . . . . . . . . . . . . . . . . . . . . . . . . . . . . . . . . . . . $ 750 6.38%
2035 . . . . . . . . . . . . . . . . . . . . . . . . . . . . . . . . . . . . . . . . . . . . . . . . . $1,000 5.70%
66 MetLife, Inc.