MetLife 2009 Annual Report Download - page 18
Download and view the complete annual report
Please find page 18 of the 2009 MetLife annual report below. You can navigate through the pages in the report by either clicking on the pages listed below, or by using the keyword search tool below to find specific information within the annual report.-
 1
1 -
2
-
3
-
4
-
5
-
6
-
7
-
 8
8 -
 9
9 -
 10
10 -
 11
11 -
 12
12 -
 13
13 -
 14
14 -
 15
15 -
 16
16 -
 17
17 -
 18
18 -
 19
19 -
 20
20 -
 21
21 -
 22
22 -
 23
23 -
 24
24 -
 25
25 -
 26
26 -
 27
27 -
 28
28 -
29
-
30
-
31
-
32
-
33
-
34
-
35
-
36
-
37
-
38
-
39
-
40
-
41
-
42
-
43
-
44
-
45
-
46
-
47
-
48
-
49
-
50
-
51
-
52
-
53
-
54
-
55
-
56
-
57
-
58
-
59
-
60
-
61
-
62
-
63
-
64
-
65
-
66
-
67
-
68
-
69
-
70
-
71
-
72
-
73
-
74
-
75
-
76
-
77
-
78
-
79
-
80
-
81
-
82
-
83
-
84
-
85
-
86
-
87
-
88
-
89
-
90
-
91
-
92
-
93
-
94
-
95
-
96
-
97
-
98
-
99
-
100
-
101
-
102
-
103
-
104
-
105
-
106
-
107
-
108
-
109
-
110
-
111
-
112
-
113
-
114
-
115
-
116
-
117
-
118
-
119
-
120
-
121
-
122
-
123
-
124
-
125
-
126
-
127
-
128
-
129
-
130
-
131
-
132
-
133
-
134
-
135
-
136
-
137
-
138
-
139
-
140
-
141
-
142
-
143
-
144
-
145
-
146
-
147
-
148
-
149
-
150
-
151
-
152
-
153
-
154
-
155
-
156
-
157
-
158
-
159
-
160
-
161
-
162
-
163
-
164
-
165
-
166
-
167
-
168
-
169
-
170
-
171
-
172
-
173
-
174
-
175
-
176
-
177
-
178
-
179
-
180
-
181
-
182
-
183
-
184
-
185
-
186
-
187
-
188
-
189
-
190
-
191
-
192
-
193
-
194
-
195
-
196
-
197
-
198
-
199
-
200
-
201
-
202
-
203
-
204
-
205
-
206
-
207
-
208
-
209
-
210
-
211
-
212
-
213
-
214
-
215
-
216
-
217
-
218
-
219
-
220
 |
 |

expected. The Company monitors these changes and only changes the assumption when its long-term expectation changes. The effect of an
increase/(decrease) by 100 basis points in the assumed future rate of return is reasonably likely to result in a decrease/(increase) in the DAC
and VOBA amortization of approximately $140 million with an offset to the Company’s unearned revenue liability of approximately $20 million
for this factor.
The Company also reviews periodically other long-term assumptions underlying the projections of estimated gross margins and profits.
These include investment returns, policyholder dividend scales, interest crediting rates, mortality, persistency, and expenses to administer
business. We annually update assumptions used in the calculation of estimated gross margins and profits which may have significantly
changed. If the update of assumptions causes expected future gross margins and profits to increase, DAC and VOBA amortization will
decrease, resulting in a current period increase to earnings. The opposite result occurs when the assumption update causes expected future
gross margins and profits to decrease.
Over the last several years, the Company’s most significant assumption updates resulting in a change to expected future gross margins
and profits and the amortization of DAC and VOBA have been updated due to revisions to expected future investment returns, expenses, in-
force or persistency assumptions and policyholder dividends on contracts included within the Insurance Products and Retirement Products
segments. During 2009, the amount of net investment gains (losses), as well as the level of separate account balances also resulted in
significant changes to expected future gross margins and profits impacting amortization of DAC and VOBA. The Company expects these
assumptions to be the ones most reasonably likely to cause significant changes in the future. Changes in these assumptions can be offsetting
and the Company is unable to predict their movement or offsetting impact over time.
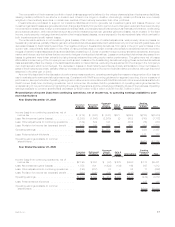
Note 6 of the Notes to the Consolidated Financial Statements provides a rollforward of DAC and VOBA for the Company for each of the
years ended December 31, 2009, 2008 and 2007, as well as a breakdown of DAC and VOBA by segment and reporting unit at December 31,
2009 and 2008.
At December 31, 2009 and 2008, DAC and VOBA for the Company was $19.3 billion and $20.1 billion, respectively. A substantial portion,
approximately 84%, of the Company’s DAC and VOBA was associated with the Insurance Products and Retirement Products segments at
December 31, 2009. At December 31, 2009 and 2008, DAC and VOBA for these segments was $16.1 billion and $17.4 billion, respectively.
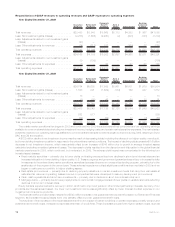
Amortization of DAC and VOBA associated with the variable & universal life and the annuities contracts within the Insurance Products and
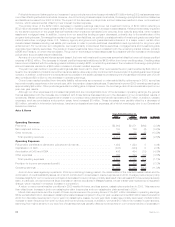
Retirement Products segments are significantly impacted by movements in equity markets. The following chart illustrates the effect on DAC
and VOBA within the Company’s U.S. Business of changing each of the respective assumptions, as well as updating estimated gross margins
or profits with actual gross margins or profits during the years ended December 31, 2009, 2008 and 2007. Increases (decreases) in DAC and
VOBA balances, as presented below, result in a corresponding decrease (increase) in amortization.
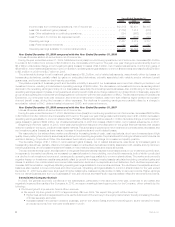
2009 2008 2007
Years Ended December 31,
(In millions)
Investmentreturn .................................................. $141 $ 70 $(34)
Separateaccountbalances............................................ (32) (708) 8
Netinvestmentgain(loss)related........................................ 712 (521) 126
Expense ........................................................ 60 61 (53)
In-force/Persistency................................................. (87) (159) 1
Policyholderdividendsandother ........................................ 174 (30) (39)
Total........................................................... $968 $(1,287) $ 9
Prior to 2008, fluctuations in the amounts presented in the table above arose principally from normal assumption reviews during the period.
The following represents significant items contributing to the changes to DAC and VOBA amortization in 2009:
• Actual gross profits decreased as a result of increased investment losses from the portfolios associated with the hedging of guaranteed
insurance obligations on variable annuities, resulting in a decrease of DAC and VOBA amortization of $141 million.
• Changes in net investment gains (losses) resulted in the following changes in DAC and VOBA amortization:
– Actual gross profits increased as a result of a decrease in liabilities associated with guarantee obligations on variable annuities,
resulting in an increase of DAC and VOBA amortization of $995 million, excluding the impact from the Company’s own credit and risk
margins, which are described below. This increase in actual gross profits was partially offset by freestanding derivative losses
associated with the hedging of such guarantee obligations, which resulted in a decrease in DAC and VOBA amortization of
$636 million.
– The narrowing of the Company’s own credit spreads increased the valuation of guarantee liabilities, decreased actual gross profits
and decreased DAC and VOBA amortization by $607 million. This was partially offset by lower risk margins which decreased the
guarantee liability valuations, increased actual gross profits and increased DAC and VOBA amortization by $20 million.
– The remainder of the impact of net investment gains (losses), which decreased DAC amortization by $484 million, was primarily
attributable to current period investment activities.
• Included in policyholder dividends and other was a decrease in amortization of $90 million as a result of changes to long term
assumptions. The remainder of the decrease was due to various immaterial items.
The following represent significant items contributing to the changes to DAC and VOBA amortization in 2008:
• The decrease in equity markets during the year significantly lowered separate account balances which lead to a significant reduction in
expected future gross profits on variable universal life contracts and variable deferred annuity contracts resulting in an increase of
$708 million in DAC and VOBA amortization.
• Changes in net investment gains (losses) resulted in the following changes in DAC and VOBA amortization:
– Actual gross profits decreased as a result of an increase in liabilities associated with guarantee obligations on variable annuities
resulting in a reduction of DAC and VOBA amortization of $1,047 million. This decrease in actual gross profits was mitigated by
freestanding derivative gains associated with the hedging of such guarantee obligations which resulted in an increase in actual gross
profits and an increase in DAC and VOBA amortization of $625 million.
12 MetLife, Inc.