MetLife 2009 Annual Report Download - page 152
Download and view the complete annual report
Please find page 152 of the 2009 MetLife annual report below. You can navigate through the pages in the report by either clicking on the pages listed below, or by using the keyword search tool below to find specific information within the annual report.-
 1
1 -
2
-
3
-
4
-
5
-
6
-
7
-
8
-
9
-
10
-
11
-
12
-
13
-
14
-
15
-
16
-
17
-
18
-
19
-
20
-
21
-
22
-
23
-
24
-
25
-
26
-
27
-
28
-
29
-
30
-
31
-
32
-
33
-
34
-
35
-
36
-
37
-
38
-
39
-
40
-
41
-
42
-
43
-
44
-
45
-
46
-
47
-
48
-
49
-
50
-
51
-
52
-
53
-
54
-
55
-
56
-
57
-
58
-
59
-
60
-
61
-
62
-
63
-
64
-
65
-
66
-
67
-
68
-
69
-
70
-
71
-
72
-
73
-
74
-
75
-
76
-
77
-
78
-
79
-
80
-
81
-
82
-
83
-
84
-
85
-
86
-
87
-
88
-
89
-
90
-
91
-
92
-
93
-
94
-
95
-
96
-
97
-
98
-
99
-
100
-
101
-
102
-
103
-
104
-
105
-
106
-
107
-
108
-
109
-
110
-
111
-
112
-
113
-
114
-
115
-
116
-
117
-
118
-
119
-
120
-
121
-
122
-
123
-
124
-
125
-
126
-
127
-
128
-
129
-
130
-
131
-
132
-
133
-
134
-
135
-
136
-
137
-
138
-
139
-
140
-
141
-
 142
142 -
 143
143 -
 144
144 -
 145
145 -
 146
146 -
 147
147 -
 148
148 -
 149
149 -
 150
150 -
 151
151 -
 152
152 -
 153
153 -
 154
154 -
 155
155 -
 156
156 -
 157
157 -
 158
158 -
 159
159 -
 160
160 -
 161
161 -
 162
162 -
163
-
164
-
165
-
166
-
167
-
168
-
169
-
170
-
171
-
172
-
173
-
174
-
175
-
176
-
177
-
178
-
179
-
180
-
181
-
182
-
183
-
184
-
185
-
186
-
187
-
188
-
189
-
190
-
191
-
192
-
193
-
194
-
195
-
196
-
197
-
198
-
199
-
200
-
201
-
202
-
203
-
204
-
205
-
206
-
207
-
208
-
209
-
210
-
211
-
212
-
213
-
214
-
215
-
216
-
217
-
218
-
219
-
220
 |
 |

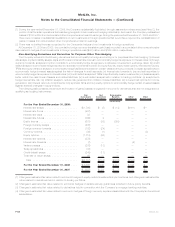
on the underlying assets, interest rates and market volatility may result in significant fluctuations in the estimated fair value of these embedded
derivatives that could materially affect net income.
The estimated fair value of the embedded equity and bond indexed derivatives contained in certain funding agreements is determined
using market standard swap valuation models and observable market inputs, including an adjustment for theCompany’sowncreditthattakes
into consideration publicly available information relating to the Company’s debt, as well as its claims paying ability. The estimated fair value of
these embedded derivatives are included, along with their funding agreements host, within policyholder account balances with changes in
estimated fair value recorded in net investment gains (losses). Changes in equity and bond indices, interest rates and the Company’s credit
standing may result in significant fluctuations in the estimated fair value of these embedded derivatives that could materially affect net income.
Assets and Liabilities of Subsidiaries Held-For-Sale — The carrying value of the assets and liabilities of subsidiaries held-for-sale reflects
those assets and liabilities which were previously determined to be financial instruments and which were reflected in other financial statement
captions in the table above in previous periods but have been reclassified to this caption to reflect the discontinued nature of the operations.
The estimated fair value of the assets and liabilities of subsidiaries held-for-sale have been determined on a basis consistent with the asset
type as described herein.
Mortgage Loan Commitments and Commitments to Fund Bank Credit Facilities, Bridge Loans and Private Corporate Bond Investments —
Theestimatedfairvaluesformortgageloancommitments and commitments to fund bank credit facilities, bridge loans and private corporate
bond investments reflected in the above table represent the difference between the discounted expected future cash flows using interest
rates that incorporate current credit risk for similar instruments on the reporting date and the principal amounts of the original commitments.
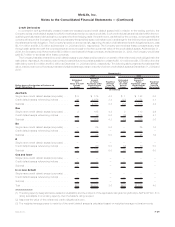
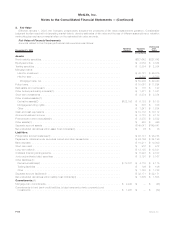
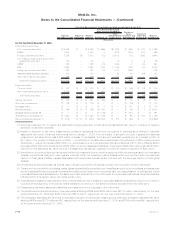
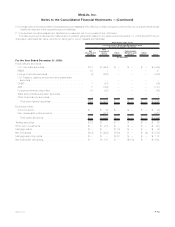
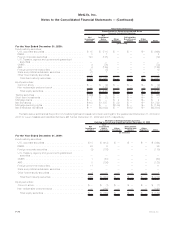
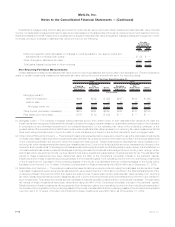
Assets and Liabilities Measured at Fair Value
Recurring Fair Value Measurements
The assets and liabilities measured at estimated fair value on a recurring basis, including those items for which the Company has elected
the fair value option, are determined as described in the preceding section. These estimated fair values and their corresponding fair value
hierarchy are summarized as follows:
Quoted Prices in
Active Markets for
Identical Assets
and Liabilities
(Level 1)
Significant Other
Observable Inputs
(Level 2)
Significant
Unobservable
Inputs
(Level 3)
Total
Estimated
Fair
Value
Fair Value Measurements at Reporting Date Using
December 31, 2009
(In millions)
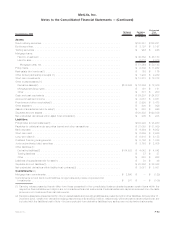
Assets
Fixed maturity securities:
U.S.corporatesecurities............................. $ — $ 65,493 $ 6,694 $ 72,187
RMBS......................................... — 42,180 1,840 44,020
Foreigncorporatesecurities........................... — 32,738 5,292 38,030
U.S. Treasury, agency and government guaranteed securities . . . . . 10,951 14,459 37 25,447
CMBS......................................... — 15,483 139 15,622
ABS .......................................... — 10,450 2,712 13,162
Foreigngovernmentsecurities ......................... 306 11,240 401 11,947
Stateandpoliticalsubdivisionsecurities................... — 7,139 69 7,208
Otherfixedmaturitysecurities ......................... — 13 6 19
Total fixed maturity securities . . . . . . . . . . . . . . . . . . . . . . . . . 11,257 199,195 17,190 227,642
Equity securities:
Commonstock................................... 490 995 136 1,621
Non-redeemablepreferredstock........................ — 359 1,104 1,463
Totalequitysecurities ............................. 490 1,354 1,240 3,084
Tradingsecurities................................... 1,886 415 83 2,384
Short-terminvestments(1) ............................. 5,650 2,500 23 8,173
Mortgageloans(2)................................... — 2,445 25 2,470
Derivativeassets(3).................................. 103 5,600 430 6,133
Netembeddedderivativeswithinassethostcontracts(4) ......... — — 76 76
Mortgageservicingrights(5) ............................ — — 878 878
Separate account assets(6) . . . . . . . . . . . . . . . . . . . . . . . . . . . . 17,601 129,545 1,895 149,041
Totalassets ..................................... $36,987 $341,054 $21,840 $399,881
F-68 MetLife, Inc.
MetLife, Inc.
Notes to the Consolidated Financial Statements — (Continued)