MetLife 2009 Annual Report Download - page 123
Download and view the complete annual report
Please find page 123 of the 2009 MetLife annual report below. You can navigate through the pages in the report by either clicking on the pages listed below, or by using the keyword search tool below to find specific information within the annual report.-
 1
1 -
2
-
3
-
4
-
5
-
6
-
7
-
8
-
9
-
10
-
11
-
12
-
13
-
14
-
15
-
16
-
17
-
18
-
19
-
20
-
21
-
22
-
23
-
24
-
25
-
26
-
27
-
28
-
29
-
30
-
31
-
32
-
33
-
34
-
35
-
36
-
37
-
38
-
39
-
40
-
41
-
42
-
43
-
44
-
45
-
46
-
47
-
48
-
49
-
50
-
51
-
52
-
53
-
54
-
55
-
56
-
57
-
58
-
59
-
60
-
61
-
62
-
63
-
64
-
65
-
66
-
67
-
68
-
69
-
70
-
71
-
72
-
73
-
74
-
75
-
76
-
77
-
78
-
79
-
80
-
81
-
82
-
83
-
84
-
85
-
86
-
87
-
88
-
89
-
90
-
91
-
92
-
93
-
94
-
95
-
96
-
97
-
98
-
99
-
100
-
101
-
102
-
103
-
104
-
105
-
106
-
107
-
108
-
109
-
110
-
111
-
112
-
 113
113 -
 114
114 -
 115
115 -
 116
116 -
 117
117 -
 118
118 -
 119
119 -
 120
120 -
 121
121 -
 122
122 -
 123
123 -
 124
124 -
 125
125 -
 126
126 -
 127
127 -
 128
128 -
 129
129 -
 130
130 -
 131
131 -
 132
132 -
 133
133 -
134
-
135
-
136
-
137
-
138
-
139
-
140
-
141
-
142
-
143
-
144
-
145
-
146
-
147
-
148
-
149
-
150
-
151
-
152
-
153
-
154
-
155
-
156
-
157
-
158
-
159
-
160
-
161
-
162
-
163
-
164
-
165
-
166
-
167
-
168
-
169
-
170
-
171
-
172
-
173
-
174
-
175
-
176
-
177
-
178
-
179
-
180
-
181
-
182
-
183
-
184
-
185
-
186
-
187
-
188
-
189
-
190
-
191
-
192
-
193
-
194
-
195
-
196
-
197
-
198
-
199
-
200
-
201
-
202
-
203
-
204
-
205
-
206
-
207
-
208
-
209
-
210
-
211
-
212
-
213
-
214
-
215
-
216
-
217
-
218
-
219
-
220
 |
 |

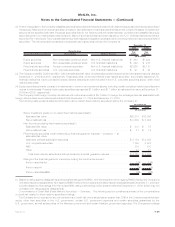
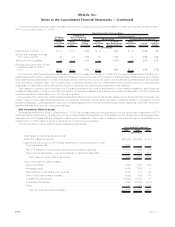
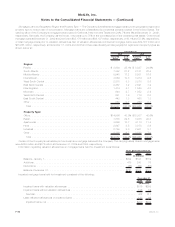
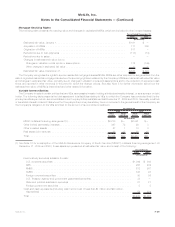
Concentration of Gross Unrealized Loss and OTTI Loss for Fixed Maturity and Equity Securities Available-for-Sale
The Company’s gross unrealized losses related to its fixed maturity and equity securities, including the portion of OTTI loss on fixed
maturity securities recognized in accumulated other comprehensive loss at December 31, 2009, of $10.8 billion and $29.8 billion at
December 31, 2009 and 2008, respectively, were concentrated, calculated as a percentage of gross unrealized loss and OTTI loss, by sector
and industry as follows:
2009 2008
December 31,
Sector:
U.S.corporatesecurities.................................................... 25% 33%
RMBS................................................................ 24 16
ABS ................................................................. 12 13
Foreigncorporatesecurities.................................................. 11 19
CMBS................................................................ 10 11
U.S.Treasury,agencyandgovernmentguaranteedsecurities............................ 9 —
Stateandpoliticalsubdivisionsecurities.......................................... 4 3
Other ................................................................ 5 5
Total................................................................ 100% 100%
Industry:
Mortgage-backed ........................................................ 34% 27%
Finance............................................................... 22 24
Asset-backed........................................................... 12 13
U.S.Treasury,agencyandgovernmentguaranteedsecurities............................ 9 —
Consumer ............................................................. 4 11
Utility ................................................................ 4 8
Stateandpoliticalsubdivisionsecurities.......................................... 4 3
Communications......................................................... 2 5
Industrial .............................................................. 1 4
Other ................................................................ 8 5
Total................................................................ 100% 100%
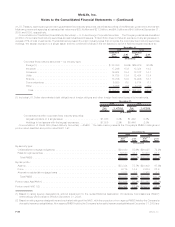
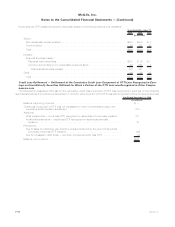
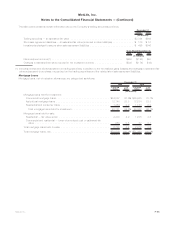
Evaluating Temporarily Impaired Available-for-Sale Securities
The following table presents the Company’s fixed maturity and equity securities with a gross unrealized loss of greater than $10 million, the
number of securities, total gross unrealized loss and percentage of total gross unrealized loss at:
Fixed Maturity
Securities Equity
Securities Fixed Maturity
Securities Equity
Securities
2009 2008
December 31,
(In millions, except number of securities)
Numberofsecurities.............................. 223 9 699 33
Totalgrossunrealizedloss.......................... $4,465 $132 $14,485 $699
Percentageoftotalgrossunrealizedloss................. 43% 48% 50% 71%
The fixed maturity and equity securities, each with a gross unrealized loss greater than $10 million, decreased $10.6 billion during the year
ended December 31, 2009. These securities were included in the Company’s OTTI review process. Based upon the Company’s current
evaluation of these securities in accordance with its impairment policy, the cause of the decline in, or improvement in, gross unrealized losses
for the year ended December 31, 2009 being primarily attributable to improving market conditions, including narrowing of credit spreads
reflecting an improvement in liquidity and the Company’s current intentions and assessments (as applicable to the type of security) about
holding, selling and any requirements to sell these securities, the Company has concluded that these securities are not other-than-tem-
porarily impaired.
In the Company’s impairment review process, the duration and severity of an unrealized loss position for equity securities is given greater
weight and consideration than for fixed maturity securities. An extended and severe unrealized loss position on a fixed maturity security may
not have any impact on the ability of the issuer to service all scheduled interest and principal payments and the Company’s evaluation of
recoverability of all contractual cash flows or the ability to recover an amount at least equal to its amortized cost based on the present value of
the expected future cash flows to be collected. In contrast, for an equity security, greater weight and consideration is given by the Company to
a decline in market value and the likelihood such market value decline will recover.
F-39MetLife, Inc.
MetLife, Inc.
Notes to the Consolidated Financial Statements — (Continued)