MetLife 2009 Annual Report Download - page 29
Download and view the complete annual report
Please find page 29 of the 2009 MetLife annual report below. You can navigate through the pages in the report by either clicking on the pages listed below, or by using the keyword search tool below to find specific information within the annual report.-
 1
1 -
2
-
3
-
4
-
5
-
6
-
7
-
8
-
9
-
10
-
11
-
12
-
13
-
14
-
15
-
16
-
17
-
18
-
 19
19 -
 20
20 -
 21
21 -
 22
22 -
 23
23 -
 24
24 -
 25
25 -
 26
26 -
 27
27 -
 28
28 -
 29
29 -
 30
30 -
 31
31 -
 32
32 -
 33
33 -
 34
34 -
 35
35 -
 36
36 -
 37
37 -
 38
38 -
 39
39 -
40
-
41
-
42
-
43
-
44
-
45
-
46
-
47
-
48
-
49
-
50
-
51
-
52
-
53
-
54
-
55
-
56
-
57
-
58
-
59
-
60
-
61
-
62
-
63
-
64
-
65
-
66
-
67
-
68
-
69
-
70
-
71
-
72
-
73
-
74
-
75
-
76
-
77
-
78
-
79
-
80
-
81
-
82
-
83
-
84
-
85
-
86
-
87
-
88
-
89
-
90
-
91
-
92
-
93
-
94
-
95
-
96
-
97
-
98
-
99
-
100
-
101
-
102
-
103
-
104
-
105
-
106
-
107
-
108
-
109
-
110
-
111
-
112
-
113
-
114
-
115
-
116
-
117
-
118
-
119
-
120
-
121
-
122
-
123
-
124
-
125
-
126
-
127
-
128
-
129
-
130
-
131
-
132
-
133
-
134
-
135
-
136
-
137
-
138
-
139
-
140
-
141
-
142
-
143
-
144
-
145
-
146
-
147
-
148
-
149
-
150
-
151
-
152
-
153
-
154
-
155
-
156
-
157
-
158
-
159
-
160
-
161
-
162
-
163
-
164
-
165
-
166
-
167
-
168
-
169
-
170
-
171
-
172
-
173
-
174
-
175
-
176
-
177
-
178
-
179
-
180
-
181
-
182
-
183
-
184
-
185
-
186
-
187
-
188
-
189
-
190
-
191
-
192
-
193
-
194
-
195
-
196
-
197
-
198
-
199
-
200
-
201
-
202
-
203
-
204
-
205
-
206
-
207
-
208
-
209
-
210
-
211
-
212
-
213
-
214
-
215
-
216
-
217
-
218
-
219
-
220
 |
 |

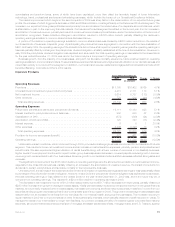
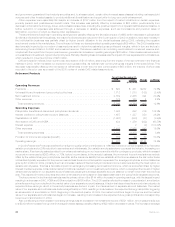
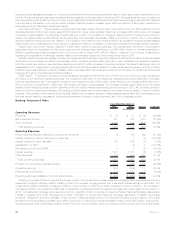
2009, we experienced a decline in insured exposures, which contributed approximately $16 million to the decrease in operating earnings.
While this decrease in exposures had a positive impact on the amount of claims, it was more than offset by the negative impact on premiums.
The decrease in exposures is largely attributable to slightly higher non-renewal rates, partially offset by greater sales of new policies. Also
contributing to the decline in earnings was a decrease of $9 million in the average premium per policy, which is primarily due to a shift in earned
exposures to lower average premium states and an increase of $10 million in loss adjustment expenses, primarily related to a decrease in
unallocated loss adjusting expense liabilities at the end of 2008.
The impact of the items discussed above can be seen in the unfavorable change in the combined ratio, excluding catastrophes, to 88.9%
in 2009 from 83.1% in 2008 and the unfavorable change in the combined ratio, including catastrophes, to 92.3% in 2009 from 91.2% in 2008.
A $25 million decrease in other expenses, including the net change in DAC, partially offset the declines in operating earnings discussed
above. This improvement resulted from decreases in sales related expenses and from minor fluctuations in a number of expense categories, a
portion of which is due to our Operational Excellence initiative.
Also contributing to the decrease in operating earnings was a decline in net investment income of $4 million which was primarily due to a
$9 million decrease from a decline in average invested assets, partially offset by an increase of $5 million due to improved yields.
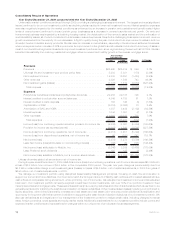
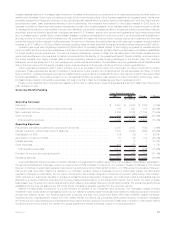
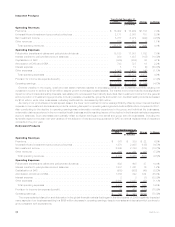
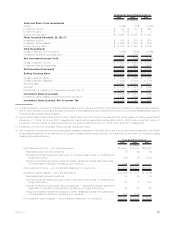
International
2009 2008 Change % Change
Years Ended December 31,
(In millions)
Operating Revenues
Premiums . . . . . . . . . . . . . . . . . . . . . . . . . . . . . . . . . . . . . . . . . . . . . . . . . . . . $3,187 $3,470 $(283) (8.2)%
Universallifeandinvestment-typeproductpolicyfees........................ 1,061 1,095 (34) (3.1)%
Netinvestmentincome............................................ 1,193 1,180 13 1.1%
Otherrevenues................................................. 14 18 (4) (22.2)%
Totaloperatingrevenues ......................................... 5,455 5,763 (308) (5.3)%
Operating Expenses
Policyholder benefits and claims and policyholder dividends . . . . . . . . . . . . . . . . . . . . 2,660 3,185 (525) (16.5)%
Interest credited to policyholder account balances . . . . . . . . . . . . . . . . . . . . . . . . . . 581 171 410 239.8%
CapitalizationofDAC............................................. (630) (798) 168 21.1%
AmortizationofDACandVOBA ...................................... 415 381 34 8.9%
Interestexpense................................................ 8 9 (1) (11.1)%
Otherexpenses ................................................ 1,797 2,079 (282) (13.6)%
Totaloperatingexpenses......................................... 4,831 5,027 (196) (3.9)%
Provisionforincometaxexpense(benefit) ............................... 161 257 (96) (37.4)%
Operatingearnings .............................................. $ 463 $ 479 $ (16) (3.3)%
An improvement in the global financial markets has contributed to a recovery of sales in the majority of our International regions and has
resulted in improved investment performance in some regions during the second half of 2009. Sales in our Asia Pacific region are down
primarily from a decrease in variable annuity sales in Japan, primarily as a result of pricing actions we took during the latter half of 2009. This
decline was somewhat offset by growth in South Korea’s fixed annuities product and an increase of variable universal life sales, which are
indications that markets are beginning to recover. We experienced growth in the pension, group life, and medical businesses of our Latin
America region, specifically in Mexico. Our EMEI region continues to have strong growth in the European variable annuity business. As we
continue to focus on our business in India, we have made significant investments in our distribution capabilities.
The reduction in operating earnings includes the adverse impact of changes in foreign currency exchange rates in 2009 as the U.S. Dollar
strengthened against the various foreign currencies. This decreased operating earnings by $99 million in 2009 relative to 2008. Excluding the
impact of changes in foreign currency exchange rates, operating earnings increased $83 million, or 22%, from the prior year. This increase
was primarily driven by higher operating earnings of $184 million in our Asia Pacific region, while operating earnings from our Latin America
and EMEI regions decreased by $83 million and $18 million, respectively.
Asia Pacific Region. Improving financial market conditions was the primary driver of the increase in operating earnings. Net investment
income in the region increased by $422 million due to an increase of $278 million from improved yields on our investment portfolio,
$111 million from the change in results of operating joint ventures, and $33 million from an increase in average invested assets. The increase
in yields was primarily due to higher income of $277 million on the trading securities portfolio, stemming from equity markets experiencing
some recovery in 2009. As our trading securities portfolio backs unit-linked policyholder liabilities, this increase in income was entirely offset
by a corresponding increase in interest credited expense. The income of the Japan joint venture improved by $103 million due to favorable
investment results and lower amortization of DAC and VOBA. The decrease in DAC and VOBA amortization was primarily due to an increase in
the market value of the joint venture’s separate account balances, which is directly tied to the improving financial markets. A factor that
determines the amount of DAC and VOBA amortization is expected future fees earned on separate account balances. Since the market value
of separate account balances have increased, it is expected that future earnings on this block of business will be higher than previously
anticipated. As a result, the amortization of DAC and VOBA was less in the current year.
Operating earnings in this region also benefited from higher surrender charges of $16 million. Difficult economic conditions in Korea during
the first half of the year resulted in a higher level of surrenders. Growth in our Japan reinsurance business and an increase in reinsurance rates
contributed $21 million to the increase in operating earnings. In addition, the favorable impact of a reduction in the liability for our variable
annuity guarantees contributed $22 million to operating earnings. The change in the liability was primarily due to an increase in separate
account balances in the Japan joint venture. These liabilities are accrued over the life of the contract in proportion to actual and future
23MetLife, Inc.