MetLife 2009 Annual Report Download - page 161
Download and view the complete annual report
Please find page 161 of the 2009 MetLife annual report below. You can navigate through the pages in the report by either clicking on the pages listed below, or by using the keyword search tool below to find specific information within the annual report.-
 1
1 -
2
-
3
-
4
-
5
-
6
-
7
-
8
-
9
-
10
-
11
-
12
-
13
-
14
-
15
-
16
-
17
-
18
-
19
-
20
-
21
-
22
-
23
-
24
-
25
-
26
-
27
-
28
-
29
-
30
-
31
-
32
-
33
-
34
-
35
-
36
-
37
-
38
-
39
-
40
-
41
-
42
-
43
-
44
-
45
-
46
-
47
-
48
-
49
-
50
-
51
-
52
-
53
-
54
-
55
-
56
-
57
-
58
-
59
-
60
-
61
-
62
-
63
-
64
-
65
-
66
-
67
-
68
-
69
-
70
-
71
-
72
-
73
-
74
-
75
-
76
-
77
-
78
-
79
-
80
-
81
-
82
-
83
-
84
-
85
-
86
-
87
-
88
-
89
-
90
-
91
-
92
-
93
-
94
-
95
-
96
-
97
-
98
-
99
-
100
-
101
-
102
-
103
-
104
-
105
-
106
-
107
-
108
-
109
-
110
-
111
-
112
-
113
-
114
-
115
-
116
-
117
-
118
-
119
-
120
-
121
-
122
-
123
-
124
-
125
-
126
-
127
-
128
-
129
-
130
-
131
-
132
-
133
-
134
-
135
-
136
-
137
-
138
-
139
-
140
-
141
-
142
-
143
-
144
-
145
-
146
-
147
-
148
-
149
-
150
-
 151
151 -
 152
152 -
 153
153 -
 154
154 -
 155
155 -
 156
156 -
 157
157 -
 158
158 -
 159
159 -
 160
160 -
 161
161 -
 162
162 -
 163
163 -
 164
164 -
 165
165 -
 166
166 -
 167
167 -
 168
168 -
 169
169 -
 170
170 -
 171
171 -
172
-
173
-
174
-
175
-
176
-
177
-
178
-
179
-
180
-
181
-
182
-
183
-
184
-
185
-
186
-
187
-
188
-
189
-
190
-
191
-
192
-
193
-
194
-
195
-
196
-
197
-
198
-
199
-
200
-
201
-
202
-
203
-
204
-
205
-
206
-
207
-
208
-
209
-
210
-
211
-
212
-
213
-
214
-
215
-
216
-
217
-
218
-
219
-
220
 |
 |

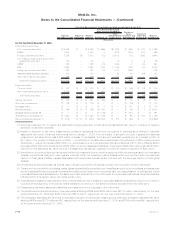
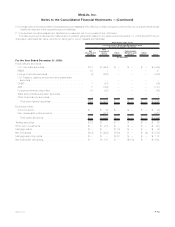
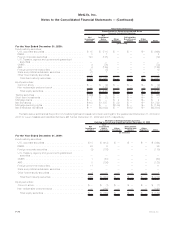
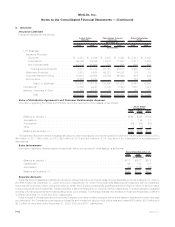
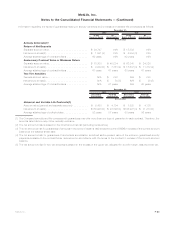
6. Deferred Policy Acquisition Costs and Value of Business Acquired
Information regarding DAC and VOBA is as follows:
DAC VOBA Total
(In millions)
Balance at January 1, 2007. . . . . . . . . . . . . . . . . . . . . . . . . . . . . . . . . . . . . . . . $13,212 $4,292 $17,504
Effectofadoptionofnewaccountingprinciple .......................... (205) (248) (453)
Capitalizations............................................... 3,064 — 3,064
Acquisitions ................................................ — 48 48
Subtotal ................................................. 16,071 4,092 20,163
Less: Amortization related to:
Netinvestmentgains(losses).................................... (115) (11) (126)
Otherexpenses ............................................ 1,881 495 2,376
Totalamortization.......................................... 1,766 484 2,250
Less:Unrealizedinvestmentgains(losses) ............................ 75 63 138
Less:Other................................................. (30) (5) (35)
Balance at December 31, 2007 . . . . . . . . . . . . . . . . . . . . . . . . . . . . . . . . . . . . . 14,260 3,550 17,810
Capitalizations............................................... 3,092 — 3,092
Acquisitions ................................................ — (5) (5)
Subtotal ................................................. 17,352 3,545 20,897
Less: Amortization related to:
Netinvestmentgains(losses).................................... 489 32 521
Otherexpenses ............................................ 2,460 508 2,968
Totalamortization.......................................... 2,949 540 3,489
Less:Unrealizedinvestmentgains(losses) ............................ (2,753) (599) (3,352)
Less:Other................................................. 503 113 616
Balance at December 31, 2008 . . . . . . . . . . . . . . . . . . . . . . . . . . . . . . . . . . . . . 16,653 3,491 20,144
Capitalizations............................................... 3,019 — 3,019
Subtotal ................................................. 19,672 3,491 23,163
Less: Amortization related to:
Netinvestmentgains(losses).................................... (625) (87) (712)
Otherexpenses ............................................ 1,754 265 2,019
Totalamortization.......................................... 1,129 178 1,307
Less:Unrealizedinvestmentgains(losses) ............................ 2,314 505 2,819
Less:Other................................................. (163) (56) (219)
Balance at December 31, 2009 . . . . . . . . . . . . . . . . . . . . . . . . . . . . . . . . . . . . . $16,392 $2,864 $19,256
See Note 2 for a description of acquisitions and dispositions.
The estimated future amortization expense allocated to other expenses for the next five years for VOBA is $394 million in 2010,
$352 million in 2011, $311 million in 2012, $264 million in 2013 and $222 million in 2014.
Amortization of DAC and VOBA is attributed to both investment gains and losses and to other expenses for the amount of gross margins or
profits originating from transactions other than investment gains and losses. Unrealized investment gains and losses represent the amount of
DAC and VOBA that would have been amortized if such gains and losses had been recognized.
F-77MetLife, Inc.
MetLife, Inc.
Notes to the Consolidated Financial Statements — (Continued)