MetLife 2009 Annual Report Download - page 35
Download and view the complete annual report
Please find page 35 of the 2009 MetLife annual report below. You can navigate through the pages in the report by either clicking on the pages listed below, or by using the keyword search tool below to find specific information within the annual report.-
 1
1 -
2
-
3
-
4
-
5
-
6
-
7
-
8
-
9
-
10
-
11
-
12
-
13
-
14
-
15
-
16
-
17
-
18
-
19
-
20
-
21
-
22
-
23
-
24
-
 25
25 -
 26
26 -
 27
27 -
 28
28 -
 29
29 -
 30
30 -
 31
31 -
 32
32 -
 33
33 -
 34
34 -
 35
35 -
 36
36 -
 37
37 -
 38
38 -
 39
39 -
 40
40 -
 41
41 -
 42
42 -
 43
43 -
 44
44 -
 45
45 -
46
-
47
-
48
-
49
-
50
-
51
-
52
-
53
-
54
-
55
-
56
-
57
-
58
-
59
-
60
-
61
-
62
-
63
-
64
-
65
-
66
-
67
-
68
-
69
-
70
-
71
-
72
-
73
-
74
-
75
-
76
-
77
-
78
-
79
-
80
-
81
-
82
-
83
-
84
-
85
-
86
-
87
-
88
-
89
-
90
-
91
-
92
-
93
-
94
-
95
-
96
-
97
-
98
-
99
-
100
-
101
-
102
-
103
-
104
-
105
-
106
-
107
-
108
-
109
-
110
-
111
-
112
-
113
-
114
-
115
-
116
-
117
-
118
-
119
-
120
-
121
-
122
-
123
-
124
-
125
-
126
-
127
-
128
-
129
-
130
-
131
-
132
-
133
-
134
-
135
-
136
-
137
-
138
-
139
-
140
-
141
-
142
-
143
-
144
-
145
-
146
-
147
-
148
-
149
-
150
-
151
-
152
-
153
-
154
-
155
-
156
-
157
-
158
-
159
-
160
-
161
-
162
-
163
-
164
-
165
-
166
-
167
-
168
-
169
-
170
-
171
-
172
-
173
-
174
-
175
-
176
-
177
-
178
-
179
-
180
-
181
-
182
-
183
-
184
-
185
-
186
-
187
-
188
-
189
-
190
-
191
-
192
-
193
-
194
-
195
-
196
-
197
-
198
-
199
-
200
-
201
-
202
-
203
-
204
-
205
-
206
-
207
-
208
-
209
-
210
-
211
-
212
-
213
-
214
-
215
-
216
-
217
-
218
-
219
-
220
 |
 |

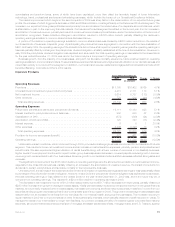
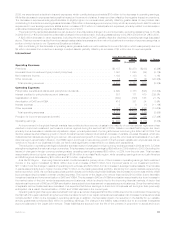
The largest impact resulting from the challenging market conditions was an increase in DAC and DSI amortization of $385 million. The
acceleration of amortization resulted primarily from the decline in the market value of our separate account balances, which is directly tied to
the financial markets. A factor that determines the amount of amortization is expected future earnings, which in this annuity business are
derived, in part, from fees earned on separate account balances. In 2008, projection of separate account fees were reduced and as a result,
we recognized more amortization in the current period. The lower market value of our separate account balances also resulted in a $96 million
decrease in policy fees and other revenues. Policy fees from variable investment-type products are typically calculated as a percentage of the
daily asset balance in the policyholder accounts. The value of these assets can fluctuate depending on performance of the equity markets.
Also contributing to the decrease in operating earnings was a decline in net investment income of $244 million, which was primarily due to
decreasing yields on our investment portfolio and an increased allocation to lower yielding more liquid investments in response to the
extraordinary market conditions. Yields were adversely impacted by the severe downturn in the global financial markets which impacted other
limited partnership interests, and cash, cash equivalents and short-term investments.
Partially offsetting the market-related declines was $15 million of lower expenses. A decrease in non-deferrable volume related expenses
was partially offset by the impact of revisions to certain pension and postretirement liabilities in 2008. The increase in the pension and
postretirement liabilities was the result of a decline in the value of the assets supporting the liabilities. The decline in the asset value is also a
direct impact of the volatile market conditions.
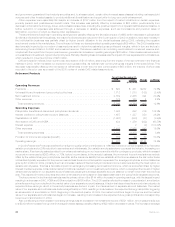
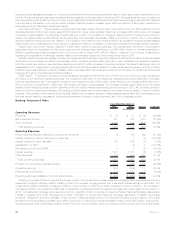
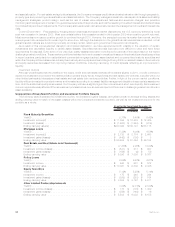
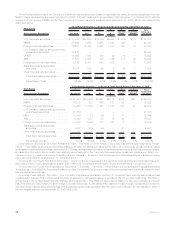
Corporate Benefit Funding
2008 2007 Change % Change
Years Ended December 31,
(In millions)
Operating Revenues
Premiums . . . . . . . . . . . . . . . . . . . . . . . . . . . . . . . . . . . . . . . . . . . . . . . . . . . $2,683 $1,265 $1,418 112.1%
Universallifeandinvestment-typeproductpolicyfees....................... 227 189 38 20.1%
Netinvestmentincome........................................... 5,874 6,636 (762) (11.5)%
Otherrevenues................................................ 359 335 24 7.2%
Totaloperatingrevenues ........................................ 9,143 8,425 718 8.5%
Operating Expenses
Policyholder benefits and claims and policyholder dividends . . . . . . . . . . . . . . . . . . . 4,977 3,365 1,612 47.9%
Interestcreditedtopolicyholderaccountbalances......................... 2,298 2,723 (425) (15.6)%
CapitalizationofDAC............................................ (18) (25) 7 28.0%
AmortizationofDACandVOBA ..................................... 29 38 (9) (23.7)%
Interestexpense............................................... 2 6 (4) (66.7)%
Otherexpenses ............................................... 476 477 (1) (0.2)%
Totaloperatingexpenses........................................ 7,764 6,584 1,180 17.9%
Provisionforincometaxexpense(benefit) .............................. 466 631 (165) (26.1)%
Operatingearnings ............................................. $ 913 $1,210 $ (297) (24.5)%
Decreasing yields on our other limited partnership interests, real estate joint ventures and fixed maturity securities caused by the severe
downturn in the global financial markets resulted in a $495 million decrease in net investment income, and was the primary reason for the
$297 million decline in operating earnings.
As many of our products are interest spread-based, the lower net investment income was somewhat offset by lower interest credited
expense on our investment-type contracts of $276 million. In addition, a charge of $75 million related to a liability refinement in the pension
closeout business and an increase in interest credited on future policyholder benefits, which is consistent with an aging block of business,
contributed to the decline in operating earnings. Such declines were partially offset by fees earned of $28 million on the surrender of a global
funding agreement contract in 2008.
29MetLife, Inc.