MetLife 2009 Annual Report Download - page 116
Download and view the complete annual report
Please find page 116 of the 2009 MetLife annual report below. You can navigate through the pages in the report by either clicking on the pages listed below, or by using the keyword search tool below to find specific information within the annual report.-
 1
1 -
2
-
3
-
4
-
5
-
6
-
7
-
8
-
9
-
10
-
11
-
12
-
13
-
14
-
15
-
16
-
17
-
18
-
19
-
20
-
21
-
22
-
23
-
24
-
25
-
26
-
27
-
28
-
29
-
30
-
31
-
32
-
33
-
34
-
35
-
36
-
37
-
38
-
39
-
40
-
41
-
42
-
43
-
44
-
45
-
46
-
47
-
48
-
49
-
50
-
51
-
52
-
53
-
54
-
55
-
56
-
57
-
58
-
59
-
60
-
61
-
62
-
63
-
64
-
65
-
66
-
67
-
68
-
69
-
70
-
71
-
72
-
73
-
74
-
75
-
76
-
77
-
78
-
79
-
80
-
81
-
82
-
83
-
84
-
85
-
86
-
87
-
88
-
89
-
90
-
91
-
92
-
93
-
94
-
95
-
96
-
97
-
98
-
99
-
100
-
101
-
102
-
103
-
104
-
105
-
 106
106 -
 107
107 -
 108
108 -
 109
109 -
 110
110 -
 111
111 -
 112
112 -
 113
113 -
 114
114 -
 115
115 -
 116
116 -
 117
117 -
 118
118 -
 119
119 -
 120
120 -
 121
121 -
 122
122 -
 123
123 -
 124
124 -
 125
125 -
 126
126 -
127
-
128
-
129
-
130
-
131
-
132
-
133
-
134
-
135
-
136
-
137
-
138
-
139
-
140
-
141
-
142
-
143
-
144
-
145
-
146
-
147
-
148
-
149
-
150
-
151
-
152
-
153
-
154
-
155
-
156
-
157
-
158
-
159
-
160
-
161
-
162
-
163
-
164
-
165
-
166
-
167
-
168
-
169
-
170
-
171
-
172
-
173
-
174
-
175
-
176
-
177
-
178
-
179
-
180
-
181
-
182
-
183
-
184
-
185
-
186
-
187
-
188
-
189
-
190
-
191
-
192
-
193
-
194
-
195
-
196
-
197
-
198
-
199
-
200
-
201
-
202
-
203
-
204
-
205
-
206
-
207
-
208
-
209
-
210
-
211
-
212
-
213
-
214
-
215
-
216
-
217
-
218
-
219
-
220
 |
 |

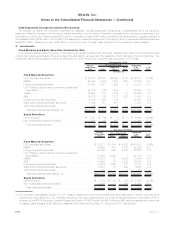
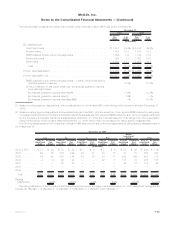
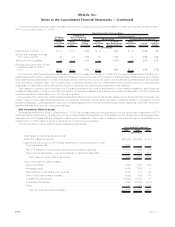
The following tables present the Company’s holdings of CMBS by rating agency designations and by vintage year at:
Cost or
Amortized
Cost
Estimated
Fair
Value
Cost or
Amortized
Cost
Estimated
Fair
Value
Cost or
Amortized
Cost
Estimated
Fair
Value
Cost or
Amortized
Cost
Estimated
Fair
Value
Cost or
Amortized
Cost
Estimated
Fair
Value
Cost or
Amortized
Cost
Estimated
Fair
Value
Aaa Aa A Baa
Below
Investment
Grade Total
December 31, 2009
(In millions)
2003 & Prior . . . $ 6,836 $ 6,918 $394 $365 $ 162 $140 $ 52 $ 41 $ 36 $ 18 $ 7,480 $ 7,482
2004 . . . . . . . . 2,240 2,255 200 166 114 71 133 87 88 58 2,775 2,637
2005 . . . . . . . . 2,956 2,853 144 108 85 65 39 24 57 51 3,281 3,101
2006 . . . . . . . . 1,087 1,009 162 139 380 323 187 129 123 48 1,939 1,648
2007 . . . . . . . . 432 314 13 12 361 257 234 153 35 13 1,075 749
2008 . . . . . . . . 5 5 — — — — — — — — 5 5
2009 . . . . . . . . — — — — — — — — — — — —
Total . . . . . . . $13,556 $13,354 $913 $790 $1,102 $856 $645 $434 $339 $188 $16,555 $15,622
Ratings
Distribution . . . 85.4% 5.1% 5.5% 2.8% 1.2% 100.0%
Cost or
Amortized
Cost
Estimated
Fair
Value
Cost or
Amortized
Cost
Estimated
Fair
Value
Cost or
Amortized
Cost
Estimated
Fair
Value
Cost or
Amortized
Cost
Estimated
Fair
Value
Cost or
Amortized
Cost
Estimated
Fair
Value
Cost or
Amortized
Cost
Estimated
Fair
Value
Aaa Aa A Baa
Below
Investment
Grade Total
December 31, 2008
(In millions)
2003 & Prior . . . $ 5,428 $ 4,975 $424 $272 $213 $124 $ 51 $ 24 $ 42 $ 17 $ 6,158 $ 5,412
2004 . . . . . . . . 2,630 2,255 205 100 114 41 47 11 102 50 3,098 2,457
2005 . . . . . . . . 3,403 2,664 187 49 40 13 5 1 18 10 3,653 2,737
2006 . . . . . . . . 1,825 1,348 110 39 25 14 94 36 — — 2,054 1,437
2007 . . . . . . . . 999 535 43 28 63 28 10 9 — — 1,115 600
2008 . . . . . . . . 1 1 — — — — — — — — 1 1
2009 . . . . . . . . — — — — — — — — — — — —
Total . . . . . . . $14,286 $11,778 $969 $488 $455 $220 $207 $ 81 $162 $ 77 $16,079 $12,644
Ratings
Distribution . . . 93.2% 3.9% 1.7% 0.6% 0.6% 100.0%
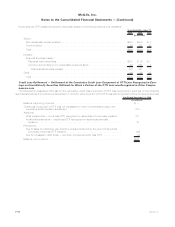
Concentrations of Credit Risk (Fixed Maturity Securities) — ABS. The Company’s holdings in ABS were $13.2 billion and $10.5 billion at
estimated fair value at December 31, 2009 and 2008, respectively. The Company’s ABS are diversified both by sector and by issuer.
F-32 MetLife, Inc.
MetLife, Inc.
Notes to the Consolidated Financial Statements — (Continued)