MetLife 2009 Annual Report Download - page 91
Download and view the complete annual report
Please find page 91 of the 2009 MetLife annual report below. You can navigate through the pages in the report by either clicking on the pages listed below, or by using the keyword search tool below to find specific information within the annual report.-
 1
1 -
2
-
3
-
4
-
5
-
6
-
7
-
8
-
9
-
10
-
11
-
12
-
13
-
14
-
15
-
16
-
17
-
18
-
19
-
20
-
21
-
22
-
23
-
24
-
25
-
26
-
27
-
28
-
29
-
30
-
31
-
32
-
33
-
34
-
35
-
36
-
37
-
38
-
39
-
40
-
41
-
42
-
43
-
44
-
45
-
46
-
47
-
48
-
49
-
50
-
51
-
52
-
53
-
54
-
55
-
56
-
57
-
58
-
59
-
60
-
61
-
62
-
63
-
64
-
65
-
66
-
67
-
68
-
69
-
70
-
71
-
72
-
73
-
74
-
75
-
76
-
77
-
78
-
79
-
80
-
 81
81 -
 82
82 -
 83
83 -
 84
84 -
 85
85 -
 86
86 -
 87
87 -
 88
88 -
 89
89 -
 90
90 -
 91
91 -
 92
92 -
 93
93 -
 94
94 -
 95
95 -
 96
96 -
 97
97 -
 98
98 -
 99
99 -
 100
100 -
 101
101 -
102
-
103
-
104
-
105
-
106
-
107
-
108
-
109
-
110
-
111
-
112
-
113
-
114
-
115
-
116
-
117
-
118
-
119
-
120
-
121
-
122
-
123
-
124
-
125
-
126
-
127
-
128
-
129
-
130
-
131
-
132
-
133
-
134
-
135
-
136
-
137
-
138
-
139
-
140
-
141
-
142
-
143
-
144
-
145
-
146
-
147
-
148
-
149
-
150
-
151
-
152
-
153
-
154
-
155
-
156
-
157
-
158
-
159
-
160
-
161
-
162
-
163
-
164
-
165
-
166
-
167
-
168
-
169
-
170
-
171
-
172
-
173
-
174
-
175
-
176
-
177
-
178
-
179
-
180
-
181
-
182
-
183
-
184
-
185
-
186
-
187
-
188
-
189
-
190
-
191
-
192
-
193
-
194
-
195
-
196
-
197
-
198
-
199
-
200
-
201
-
202
-
203
-
204
-
205
-
206
-
207
-
208
-
209
-
210
-
211
-
212
-
213
-
214
-
215
-
216
-
217
-
218
-
219
-
220
 |
 |

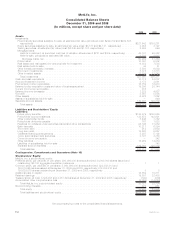
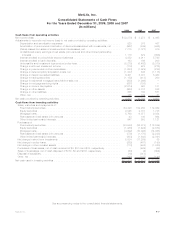
MetLife, Inc.
Consolidated Statements of Cash Flows
For the Years Ended December 31, 2009, 2008 and 2007
(In millions)
2009 2008 2007
Cash flows from operating activities
Netincome(loss) ..................................................... $ (2,278) $ 3,278 $ 4,465
Adjustments to reconcile net income (loss) to net cash provided by operating activities:
Depreciationandamortizationexpenses ................................... 520 375 457
Amortization of premiums and accretion of discounts associated with investments, net . . . . . (967) (939) (955)
(Gains)lossesfromsalesofinvestmentsandbusinesses,net...................... 7,715 (1,127) 619
Undistributed equity earnings of real estate joint ventures and other limited partnership
interests....................................................... 1,118 679 (606)
Interestcreditedtopolicyholderaccountbalances............................. 4,852 4,911 5,790
Interestcreditedtobankdeposits........................................ 163 166 200
Universallifeandinvestment-typeproductpolicyfees........................... (5,218) (5,462) (5,310)
Changeinaccruedinvestmentincome .................................... (110) 428 (275)
Changeinpremiumsandotherreceivables.................................. (1,653) (1,929) (283)
Changeindeferredpolicyacquisitioncosts,net .............................. (1,837) 545 (1,178)
Changeininsurance-relatedliabilities ..................................... 6,401 5,307 5,463
Changeintradingsecurities ........................................... (1,152) (418) 200
Changeinresidentialmortgageloansheld-for-sale,net.......................... (800) (1,946) —
Changeinmortgageservicingrights...................................... (687) (185) —
Changeinincometaxpayable.......................................... (2,614) 920 101
Changeinotherassets .............................................. (660) 5,737 582
Changeinotherliabilities ............................................. 865 163 581
Other,net ....................................................... 145 199 51
Netcashprovidedbyoperatingactivities...................................... 3,803 10,702 9,902
Cash flows from investing activities
Sales, maturities and repayments of:
Fixedmaturitysecurities.............................................. 64,428 102,250 112,062
Equitysecurities................................................... 2,545 2,707 1,738
Mortgageloans.................................................... 5,769 6,077 9,854
Realestateandrealestatejointventures................................... 43 140 664
Otherlimitedpartnershipinterests........................................ 947 593 1,121
Purchases of:
Fixedmaturitysecurities.............................................. (83,940) (86,874) (112,534)
Equitysecurities................................................... (1,986) (1,494) (2,883)
Mortgageloans.................................................... (4,692) (10,096) (14,365)
Realestateandrealestatejointventures................................... (579) (1,170) (2,228)
Otherlimitedpartnershipinterests........................................ (803) (1,643) (2,041)
Netchangeinshort-terminvestments ...................................... 5,534 (11,269) 55
Netchangeinpolicyloans.............................................. (259) (467) (190)
Netchangeinotherinvestedassets ....................................... (713) (492) (1,020)
Purchases of businesses, net of cash received of $0, $314 and $13, respectively . . . . . . . . . . — (469) (43)
Sales of businesses, net of cash disposed of $180, $0 and $763, respectively . . . . . . . . . . . . (50) (4) (694)
Disposalofsubsidiary................................................. (19) (313) —
Other,net......................................................... (160) (147) (140)
Netcashusedininvestingactivities ......................................... $(13,935) $ (2,671) $ (10,644)
See accompanying notes to the consolidated financial statements.
F-7MetLife, Inc.