MetLife 2009 Annual Report Download - page 156
Download and view the complete annual report
Please find page 156 of the 2009 MetLife annual report below. You can navigate through the pages in the report by either clicking on the pages listed below, or by using the keyword search tool below to find specific information within the annual report.-
 1
1 -
2
-
3
-
4
-
5
-
6
-
7
-
8
-
9
-
10
-
11
-
12
-
13
-
14
-
15
-
16
-
17
-
18
-
19
-
20
-
21
-
22
-
23
-
24
-
25
-
26
-
27
-
28
-
29
-
30
-
31
-
32
-
33
-
34
-
35
-
36
-
37
-
38
-
39
-
40
-
41
-
42
-
43
-
44
-
45
-
46
-
47
-
48
-
49
-
50
-
51
-
52
-
53
-
54
-
55
-
56
-
57
-
58
-
59
-
60
-
61
-
62
-
63
-
64
-
65
-
66
-
67
-
68
-
69
-
70
-
71
-
72
-
73
-
74
-
75
-
76
-
77
-
78
-
79
-
80
-
81
-
82
-
83
-
84
-
85
-
86
-
87
-
88
-
89
-
90
-
91
-
92
-
93
-
94
-
95
-
96
-
97
-
98
-
99
-
100
-
101
-
102
-
103
-
104
-
105
-
106
-
107
-
108
-
109
-
110
-
111
-
112
-
113
-
114
-
115
-
116
-
117
-
118
-
119
-
120
-
121
-
122
-
123
-
124
-
125
-
126
-
127
-
128
-
129
-
130
-
131
-
132
-
133
-
134
-
135
-
136
-
137
-
138
-
139
-
140
-
141
-
142
-
143
-
144
-
145
-
 146
146 -
 147
147 -
 148
148 -
 149
149 -
 150
150 -
 151
151 -
 152
152 -
 153
153 -
 154
154 -
 155
155 -
 156
156 -
 157
157 -
 158
158 -
 159
159 -
 160
160 -
 161
161 -
 162
162 -
 163
163 -
 164
164 -
 165
165 -
 166
166 -
167
-
168
-
169
-
170
-
171
-
172
-
173
-
174
-
175
-
176
-
177
-
178
-
179
-
180
-
181
-
182
-
183
-
184
-
185
-
186
-
187
-
188
-
189
-
190
-
191
-
192
-
193
-
194
-
195
-
196
-
197
-
198
-
199
-
200
-
201
-
202
-
203
-
204
-
205
-
206
-
207
-
208
-
209
-
210
-
211
-
212
-
213
-
214
-
215
-
216
-
217
-
218
-
219
-
220
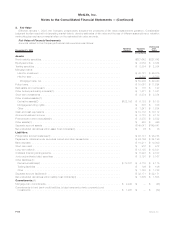
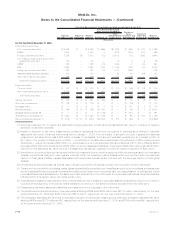
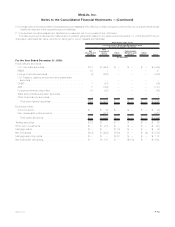
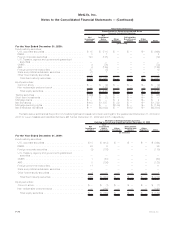
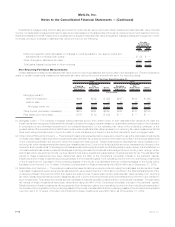
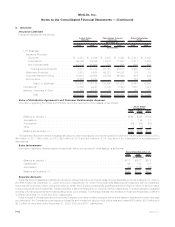
 |
 |

Balance,
December 31, 2007 Impact of
Adoption(2) Balance,
January 1, Earnings(3), (4)
Other
Comprehensive
Income (Loss)
Purchases,
Sales,
Issuances and
Settlements(5)
Transfer In
and/or Out
of Level 3 (6) Balance,
December 31,
Tota l Realized/Unrealized
Gains (Losses) included in:
Fair Value Measurements Using Significant Unobservable Inputs (Level 3) (1)
(In millions)
For the Year Ended December 31, 2008:
Fixed maturity securities:
U.S.corporatesecurities.......... $ 8,368 $ — $ 8,368 $ (696) $(1,758) $ 859 $ 725 $7,498
RMBS...................... 1,423 — 1,423 4 (218) (204) (410) 595
Foreigncorporatesecurities ........ 7,228 (8) 7,220 (12) (2,873) (57) 1,666 5,944
U.S. Treasury, agency and government
guaranteedsecurities........... 80 — 80 — (1) 3 6 88
CMBS ..................... 539 — 539 (72) (136) 2 (73) 260
ABS....................... 4,490 — 4,490 (125) (1,136) (740) (37) 2,452
Foreigngovernmentsecurities....... 785 — 785 19 (101) (295) — 408
State and political subdivision securities . . . . . 124 — 124 — (8) 45 (38) 123
Otherfixedmaturitysecurities ....... 289 — 289 1 (41) (209) — 40
Total fixed maturity securities . . . . . . $23,326 $ (8) $23,318 $ (881) $(6,272) $ (596) $ 1,839 $17,408
Equity securities:
Commonstock................ $ 183 $ — $ 183 $ (2) $ (12) $ (46) $ (18) $ 105
Non-redeemable preferred stock . . . . . 2,188 — 2,188 (195) (466) (242) (11) 1,274
Totalequitysecurities........... $2,371 $ — $2,371 $ (197) $ (478) $ (288) $ (29) $ 1,379
Tradingsecurities................ $ 183 $ 8 $ 191 $ (26) $ — $ 18 $ (8) $ 175
Short-terminvestments ............ $ 179 $ — $ 179 $ — $ — $ (79) $ — $ 100
Mortgageloans ................. $ — $ — $ — $ 4 $ — $ 171 $ 2 $ 177
Netderivatives(7)................ $ 789 $ (1) $ 788 $1,729 $ — $ 29 $ 1 $ 2,547
Mortgageservicingrights(8),(9).......... $ — $ — $ — $ (149) $ — $ 340 $ — $ 191
Separateaccountassets(10)......... $ 1,464 $ — $1,464 $ (129) $ — $ 90 $ 333 $ 1,758
Netembeddedderivatives(11) ........ $ (278) $ 24 $ (254) $(2,500) $ (81) $ (94) $ — $(2,929)
(1) Amounts presented do not reflect any associated hedging activities. Actual earnings associated with Level 3, inclusive of hedging
activities, could differ materially.
(2) Impact of adoption of fair value measurement guidance represents the amount recognized in earnings as a change in estimate
associated with Level 3 financial instruments held at January 1, 2008. The net impact of adoption on Level 3 assets and liabilities
presented in the table above was a $23 million increase to net assets. Such amount was also impacted by an increase to DAC of
$17 million. The impact of this adoption on RGA — not reflected in the table above as a result of the reflection of RGA in discontinued
operations — was a net increase of $2 million (i.e., a decrease in Level 3 net embedded derivative liabilities of $17 million offset by a DAC
decrease of $15 million) for a total impact of $42 million on Level 3 assets and liabilities. This impact of $42 million along with a $12 million
reduction in the estimated fair value of Level 2 freestanding derivatives, resulted in a total net impact of adoption of $30 million.
(3) Amortization of premium/discount is included within net investment income which is reported within the earnings caption of total gains
(losses). Impairments charged to earnings are included within net investment gains (losses) which are reported within the earnings
caption of total gains (losses). Lapses associated with embedded derivatives are included with the earnings caption of total gains
(losses).
(4) Interest and dividend accruals, as well as cash interest coupons and dividends received, are excluded from the rollforward.
(5) The amount reported within purchases, sales, issuances and settlements is the purchase/issuance price (for purchases and issuances)
and the sales/settlement proceeds (for sales and settlements) based upon the actual date purchased/issued or sold/settled. Items
purchased/issued and sold/settled in the same period are excluded from the rollforward. For embedded derivatives, attributed fees are
included within this caption along with settlements, if any.
(6) Total gains and losses (in earnings and other comprehensive income (loss)) are calculated assuming transfers in and/or out of Level 3
occurred at the beginning of the period. Items transferred in and out in the same period are excluded from the rollforward.
(7) Freestanding derivative assets and liabilities are presented net for purposes of the rollforward.
(8) The additions and reductions (due to loan payments) affecting MSRs were $628 million and ($113) million, respectively, for the year
ended December 31, 2009 and $350 million and ($10) million, respectively, for the year ended December 31, 2008.
(9) The changes in estimated fair value due to changes in valuation model inputs or assumptions, and other changes in estimated fair value
affecting MSRs were $172 million and $0, respectively, for the year ended December 31, 2009, and ($149) million and $0, respectively,
for the year ended December 31, 2008.
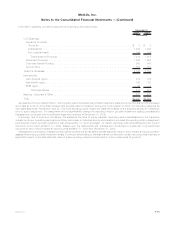
F-72 MetLife, Inc.
MetLife, Inc.
Notes to the Consolidated Financial Statements — (Continued)