MetLife 2009 Annual Report Download - page 78
Download and view the complete annual report
Please find page 78 of the 2009 MetLife annual report below. You can navigate through the pages in the report by either clicking on the pages listed below, or by using the keyword search tool below to find specific information within the annual report.-
 1
1 -
2
-
3
-
4
-
5
-
6
-
7
-
8
-
9
-
10
-
11
-
12
-
13
-
14
-
15
-
16
-
17
-
18
-
19
-
20
-
21
-
22
-
23
-
24
-
25
-
26
-
27
-
28
-
29
-
30
-
31
-
32
-
33
-
34
-
35
-
36
-
37
-
38
-
39
-
40
-
41
-
42
-
43
-
44
-
45
-
46
-
47
-
48
-
49
-
50
-
51
-
52
-
53
-
54
-
55
-
56
-
57
-
58
-
59
-
60
-
61
-
62
-
63
-
64
-
65
-
66
-
67
-
 68
68 -
 69
69 -
 70
70 -
 71
71 -
 72
72 -
 73
73 -
 74
74 -
 75
75 -
 76
76 -
 77
77 -
 78
78 -
 79
79 -
 80
80 -
 81
81 -
 82
82 -
 83
83 -
 84
84 -
 85
85 -
 86
86 -
 87
87 -
 88
88 -
89
-
90
-
91
-
92
-
93
-
94
-
95
-
96
-
97
-
98
-
99
-
100
-
101
-
102
-
103
-
104
-
105
-
106
-
107
-
108
-
109
-
110
-
111
-
112
-
113
-
114
-
115
-
116
-
117
-
118
-
119
-
120
-
121
-
122
-
123
-
124
-
125
-
126
-
127
-
128
-
129
-
130
-
131
-
132
-
133
-
134
-
135
-
136
-
137
-
138
-
139
-
140
-
141
-
142
-
143
-
144
-
145
-
146
-
147
-
148
-
149
-
150
-
151
-
152
-
153
-
154
-
155
-
156
-
157
-
158
-
159
-
160
-
161
-
162
-
163
-
164
-
165
-
166
-
167
-
168
-
169
-
170
-
171
-
172
-
173
-
174
-
175
-
176
-
177
-
178
-
179
-
180
-
181
-
182
-
183
-
184
-
185
-
186
-
187
-
188
-
189
-
190
-
191
-
192
-
193
-
194
-
195
-
196
-
197
-
198
-
199
-
200
-
201
-
202
-
203
-
204
-
205
-
206
-
207
-
208
-
209
-
210
-
211
-
212
-
213
-
214
-
215
-
216
-
217
-
218
-
219
-
220
 |
 |

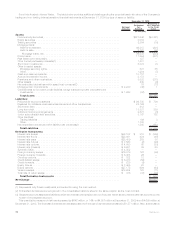
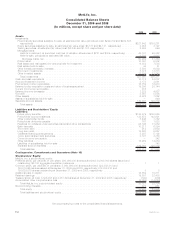
Sensitivity Analysis: Interest Rates. The table below provides additional detail regarding the potential loss in fair value of the Company’s
trading and non-trading interest sensitive financial instruments at December 31, 2009 by type of asset or liability:
Notional
Amount
Estimated
Fair
Value(3)
Assuming a
10% Increase
in the Yield
Curve
December 31, 2009
(In millions)
Assets:
Fixedmaturitysecurities............................................... $227,642 $(4,761)
Equitysecurities .................................................... 3,084 —
Tradingsecurities ................................................... 2,384 (10)
Mortgage loans:
Held-for-investment................................................. 46,315 (201)
Held-for-sale..................................................... 2,728 (32)
Mortgageloans,net............................................... 49,043 (233)
Policyloans....................................................... 11,294 (201)
Realestatejointventures(1)............................................. 127 —
Otherlimitedpartnershipinterests(1)....................................... 1,581 —
Short-terminvestments................................................ 8,374 (1)
Other invested assets:
Mortgageservicingrights............................................. 878 85
Other.......................................................... 1,284 (7)
Cashandcashequivalents............................................. 10,112 —
Accruedinvestmentincome............................................. 3,173 —
Premiumsandotherreceivables.......................................... 3,532 (211)
Otherassets ...................................................... 440 (6)
Netembeddedderivativeswithinassethostcontracts(2).......................... 76 (17)
Mortgageloancommitments ............................................ $ 2,220 (48) 1
Commitments to fund bank credit facilities, bridge loans and private corporate bond
investments...................................................... $ 1,263 (52) —
Total Assets .................................................... $(5,361)
Liabilities:
Policyholderaccountbalances........................................... $ 96,735 $ 786
Payablesforcollateralundersecuritiesloanedandothertransactions.................. 24,196 —
Short-termdebt .................................................... 912 —
Long-termdebt..................................................... 13,831 339
Collateralfinancingarrangements......................................... 2,877 (8)
Juniorsubordinateddebtsecurities........................................ 3,167 152
Other liabilities:
Tradingliabilities................................................... 106 3
Other.......................................................... 1,788 —
Netembeddedderivativeswithinliabilityhostcontracts(2) ......................... 1,505 994
Total Liabilities .................................................. $2,266
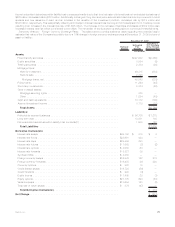
Derivative Instruments:
Interestrateswaps .................................................. $38,152 $ 315 $ (866)
Interestratefloors................................................... $23,691 424 (48)
Interestratecaps ................................................... $28,409 283 86
Interestratefutures .................................................. $ 7,563 (2) (29)
Interestrateoptions.................................................. $ 4,050 60 (33)
Interestrateforwards................................................. $ 9,921 39 65
SyntheticGICs..................................................... $ 4,352 — —
Foreigncurrencyswaps ............................................... $16,879 122 (36)
Foreigncurrencyforwards.............................................. $ 6,485 26 —
Currencyoptions.................................................... $ 822 18 —
Creditdefaultswaps ................................................. $ 6,723 (56) —
Creditforwards..................................................... $ 220 (4) —
Equityfutures...................................................... $ 7,405 23 —
Equityoptions ..................................................... $27,175 694 (64)
Varianceswaps..................................................... $13,654 123 (11)
Totalrateofreturnswaps .............................................. $ 376 (47) (26)
Total Derivative Instruments ........................................ $ (962)
Net Change........................................................ $(4,057)
(1) Represents only those investments accounted for using the cost method.
(2) Embedded derivatives are recognized in the consolidated balance sheet in the same caption as the host contract.
(3) Separate account assets and liabilities which are interest rate sensitive are not included herein as any interest rate risk is borne by the
holder of the separate account.
This quantitative measure of risk has decreased by $642 million, or 14%, to $4,057 million at December 31, 2009 from $4,699 million at
December 31, 2008. The decrease in interest rate risk associated with the use of derivatives decreased by $1,571 million. Also, a decrease in
72 MetLife, Inc.