MetLife 2009 Annual Report Download - page 153
Download and view the complete annual report
Please find page 153 of the 2009 MetLife annual report below. You can navigate through the pages in the report by either clicking on the pages listed below, or by using the keyword search tool below to find specific information within the annual report.-
 1
1 -
2
-
3
-
4
-
5
-
6
-
7
-
8
-
9
-
10
-
11
-
12
-
13
-
14
-
15
-
16
-
17
-
18
-
19
-
20
-
21
-
22
-
23
-
24
-
25
-
26
-
27
-
28
-
29
-
30
-
31
-
32
-
33
-
34
-
35
-
36
-
37
-
38
-
39
-
40
-
41
-
42
-
43
-
44
-
45
-
46
-
47
-
48
-
49
-
50
-
51
-
52
-
53
-
54
-
55
-
56
-
57
-
58
-
59
-
60
-
61
-
62
-
63
-
64
-
65
-
66
-
67
-
68
-
69
-
70
-
71
-
72
-
73
-
74
-
75
-
76
-
77
-
78
-
79
-
80
-
81
-
82
-
83
-
84
-
85
-
86
-
87
-
88
-
89
-
90
-
91
-
92
-
93
-
94
-
95
-
96
-
97
-
98
-
99
-
100
-
101
-
102
-
103
-
104
-
105
-
106
-
107
-
108
-
109
-
110
-
111
-
112
-
113
-
114
-
115
-
116
-
117
-
118
-
119
-
120
-
121
-
122
-
123
-
124
-
125
-
126
-
127
-
128
-
129
-
130
-
131
-
132
-
133
-
134
-
135
-
136
-
137
-
138
-
139
-
140
-
141
-
142
-
 143
143 -
 144
144 -
 145
145 -
 146
146 -
 147
147 -
 148
148 -
 149
149 -
 150
150 -
 151
151 -
 152
152 -
 153
153 -
 154
154 -
 155
155 -
 156
156 -
 157
157 -
 158
158 -
 159
159 -
 160
160 -
 161
161 -
 162
162 -
 163
163 -
164
-
165
-
166
-
167
-
168
-
169
-
170
-
171
-
172
-
173
-
174
-
175
-
176
-
177
-
178
-
179
-
180
-
181
-
182
-
183
-
184
-
185
-
186
-
187
-
188
-
189
-
190
-
191
-
192
-
193
-
194
-
195
-
196
-
197
-
198
-
199
-
200
-
201
-
202
-
203
-
204
-
205
-
206
-
207
-
208
-
209
-
210
-
211
-
212
-
213
-
214
-
215
-
216
-
217
-
218
-
219
-
220
 |
 |

Quoted Prices in
Active Markets for
Identical Assets
and Liabilities
(Level 1)
Significant Other
Observable Inputs
(Level 2)
Significant
Unobservable
Inputs
(Level 3)
Total
Estimated
Fair
Value
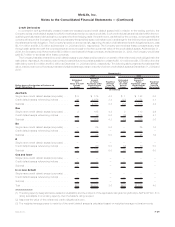
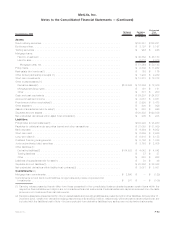
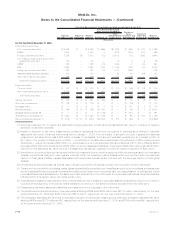
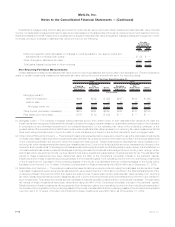
Fair Value Measurements at Reporting Date Using
December 31, 2009
(In millions)
Liabilities
Derivativeliabilities(3) ................................ $ 51 $ 3,990 $ 74 $ 4,115
Net embedded derivatives within liability host contracts(4) . . . . . . . . . — (26) 1,531 1,505
Tradingliabilities(7).................................. 106 — — 106
Totalliabilities.................................... $ 157 $ 3,964 $ 1,605 $ 5,726
Quoted Prices in
Active Markets for
Identical Assets
and Liabilities
(Level 1)
Significant Other
Observable Inputs
(Level 2)
Significant
Unobservable
Inputs
(Level 3)
Total
Estimated
Fair
Value
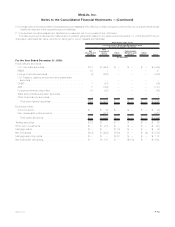
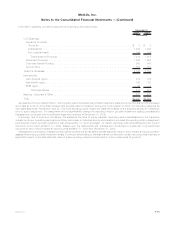
Fair Value Measurements at Reporting Date Using
December 31, 2008
(In millions)
Assets
Fixed maturity securities:
U.S.corporatesecurities............................. $ — $ 55,805 $ 7,498 $ 63,303
RMBS......................................... — 35,433 595 36,028
Foreigncorporatesecurities........................... — 23,735 5,944 29,679
U.S. Treasury, agency and government guaranteed securities . . . . . 10,132 11,090 88 21,310
CMBS......................................... — 12,384 260 12,644
ABS .......................................... — 8,071 2,452 10,523
Foreigngovernmentsecurities ......................... 282 9,463 408 10,153
Stateandpoliticalsubdivisionsecurities................... — 4,434 123 4,557
Otherfixedmaturitysecurities ......................... — 14 40 54
Total fixed maturity securities . . . . . . . . . . . . . . . . . . . . . . . . . 10,414 160,429 17,408 188,251
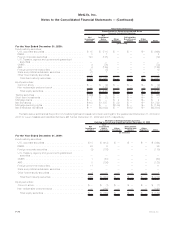
Equity securities:
Commonstock................................... 413 1,167 105 1,685
Non-redeemablepreferredstock........................... — 238 1,274 1,512
Totalequitysecurities ............................. 413 1,405 1,379 3,197
Tradingsecurities................................... 587 184 175 946
Short-terminvestments(1) ............................. 10,549 2,913 100 13,562
Mortgageloans(2)................................... — 1,798 177 1,975
Derivativeassets(3).................................. 55 9,483 2,768 12,306
Net embedded derivatives within asset host contracts(4) . . . . . . . . . — — 205 205
Mortgageservicingrights(5) ............................ — — 191 191
Separateaccountassets(6) ............................ 85,886 33,195 1,758 120,839
Totalassets ..................................... $107,904 $209,407 $24,161 $341,472
Liabilities
Derivativeliabilities(3) ................................ $ 273 $ 3,548 $ 221 $ 4,042
Net embedded derivatives within liability host contracts (4) . . . . . . . . — (83) 3,134 3,051
Tradingliabilities(7).................................. 57 — — 57
Totalliabilities.................................... $ 330 $ 3,465 $ 3,355 $ 7,150
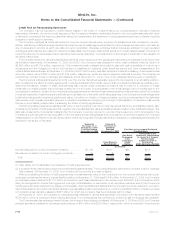
(1) Short-term investments as presented in the tables above differ from the amounts presented in the consolidated balance sheets because
certain short-term investments are not measured at estimated fair value (e.g. time deposits, money market funds, etc.).
(2) Mortgage loans as presented in the tables above differ from the amount presented in the consolidated balance sheets as these tables
only include residential mortgage loans held-for-sale measured at estimated fair value on a recurring basis.
(3) Derivative assets are presented within other invested assets and derivative liabilities are presented within other liabilities. The amounts are
presented gross in the tables above to reflect the presentation in the consolidated balance sheets, but are presented net for purposes of
F-69MetLife, Inc.
MetLife, Inc.
Notes to the Consolidated Financial Statements — (Continued)