MetLife 2009 Annual Report Download - page 10
Download and view the complete annual report
Please find page 10 of the 2009 MetLife annual report below. You can navigate through the pages in the report by either clicking on the pages listed below, or by using the keyword search tool below to find specific information within the annual report.-
 1
1 -
 2
2 -
 3
3 -
 4
4 -
 5
5 -
 6
6 -
 7
7 -
 8
8 -
 9
9 -
 10
10 -
 11
11 -
 12
12 -
 13
13 -
 14
14 -
 15
15 -
 16
16 -
 17
17 -
 18
18 -
 19
19 -
 20
20 -
 21
21 -
22
-
23
-
24
-
25
-
26
-
27
-
28
-
29
-
30
-
31
-
32
-
33
-
34
-
35
-
36
-
37
-
38
-
39
-
40
-
41
-
42
-
43
-
44
-
45
-
46
-
47
-
48
-
49
-
50
-
51
-
52
-
53
-
54
-
55
-
56
-
57
-
58
-
59
-
60
-
61
-
62
-
63
-
64
-
65
-
66
-
67
-
68
-
69
-
70
-
71
-
72
-
73
-
74
-
75
-
76
-
77
-
78
-
79
-
80
-
81
-
82
-
83
-
84
-
85
-
86
-
87
-
88
-
89
-
90
-
91
-
92
-
93
-
94
-
95
-
96
-
97
-
98
-
99
-
100
-
101
-
102
-
103
-
104
-
105
-
106
-
107
-
108
-
109
-
110
-
111
-
112
-
113
-
114
-
115
-
116
-
117
-
118
-
119
-
120
-
121
-
122
-
123
-
124
-
125
-
126
-
127
-
128
-
129
-
130
-
131
-
132
-
133
-
134
-
135
-
136
-
137
-
138
-
139
-
140
-
141
-
142
-
143
-
144
-
145
-
146
-
147
-
148
-
149
-
150
-
151
-
152
-
153
-
154
-
155
-
156
-
157
-
158
-
159
-
160
-
161
-
162
-
163
-
164
-
165
-
166
-
167
-
168
-
169
-
170
-
171
-
172
-
173
-
174
-
175
-
176
-
177
-
178
-
179
-
180
-
181
-
182
-
183
-
184
-
185
-
186
-
187
-
188
-
189
-
190
-
191
-
192
-
193
-
194
-
195
-
196
-
197
-
198
-
199
-
200
-
201
-
202
-
203
-
204
-
205
-
206
-
207
-
208
-
209
-
210
-
211
-
212
-
213
-
214
-
215
-
216
-
217
-
218
-
219
-
220
 |
 |

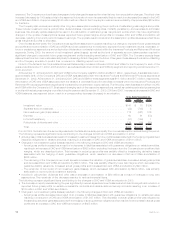
2009 2008 2007 2006 2005
December 31,
(In millions)
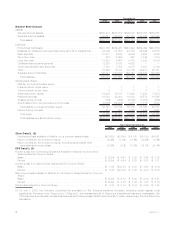
Balance Sheet Data(1)
Assets:
Generalaccountassets.................................. $390,273 $380,839 $399,007 $383,758 $354,857
Separate account assets . . . . . . . . . . . . . . . . . . . . . . . . . . . . . . . . . 149,041 120,839 160,142 144,349 127,855
Totalassets........................................ $539,314 $501,678 $559,149 $528,107 $482,712
Liabilities:
Policyholderliabilities(2).................................. $283,759 $282,261 $261,442 $252,099 $243,834
Payables for collateral under securities loaned and other transactions . . . . 24,196 31,059 44,136 45,846 34,515
Bankdeposits........................................ 10,211 6,884 4,534 4,638 4,339
Short-termdebt....................................... 912 2,659 667 1,449 1,414
Long-termdebt ....................................... 13,220 9,667 9,100 8,822 9,088
Collateralfinancingarrangements ........................... 5,297 5,192 4,882 — —
Junior subordinated debt securities . . . . . . . . . . . . . . . . . . . . . . . . . . 3,191 3,758 4,075 3,381 2,134
Other.............................................. 15,989 15,374 33,186 32,277 29,141
Separate account liabilities . . . . . . . . . . . . . . . . . . . . . . . . . . . . . . . . 149,041 120,839 160,142 144,349 127,855
Total liabilities . . . . . . . . . . . . . . . . . . . . . . . . . . . . . . . . . . . . . . . 505,816 477,693 522,164 492,861 452,320
Stockholders’ Equity:
MetLife, Inc.’s stockholders’ equity:
Preferredstock,atparvalue............................... 1 1 1 1 1
Commonstock,atparvalue............................... 8 8 8 8 8
Additional paid-in capital . . . . . . . . . . . . . . . . . . . . . . . . . . . . . . . . . 16,859 15,811 17,098 17,454 17,274
Retainedearnings ..................................... 19,501 22,403 19,884 16,574 10,865
Treasurystock,atcost .................................. (190) (236) (2,890) (1,357) (959)
Accumulated other comprehensive income (loss) . . . . . . . . . . . . . . . . . (3,058) (14,253) 1,078 1,118 1,912
Total MetLife, Inc.’s stockholders’ equity . . . . . . . . . . . . . . . . . . . . . . 33,121 23,734 35,179 33,798 29,101
Noncontrollinginterests.................................. 377 251 1,806 1,448 1,291
Totalequity ........................................ 33,498 23,985 36,985 35,246 30,392
Total liabilities and stockholders’ equity . . . . . . . . . . . . . . . . . . . . . . $539,314 $501,678 $559,149 $528,107 $482,712
2009 2008 2007 2006 2005
Years Ended December 31,
(In millions, except per share data)
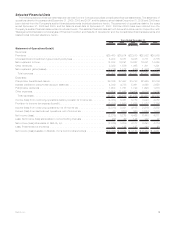
Other Data(1), (3)
Net income (loss) available to MetLife, Inc.’s common shareholders . . . . . . . . . $(2,368) $ 3,084 $ 4,180 $ 6,159 $ 4,651
ReturnonMetLife,Inc.’scommonequity .......................... (9.0)% 11.2% 12.9% 20.9% 18.6%
Return on MetLife, Inc.’s common equity, excluding accumulated other
comprehensiveincome(loss) ................................ (6.8)% 9.1% 13.3% 22.1% 20.7%
EPS Data(1), (4)
Income (Loss) from Continuing Operations Available to MetLife, Inc.’s Common
Shareholders Per Common Share:
Basic ................................................. $ (2.94) $ 4.60 $ 5.32 $ 3.64 $ 3.85
Diluted ................................................ $ (2.94) $ 4.54 $ 5.20 $ 3.60 $ 3.81
Income (Loss) from Discontinued Operations Per Common Share:
Basic ................................................. $ 0.05 $(0.41) $ 0.30 $ 4.45 $ 2.36
Diluted ................................................ $ 0.05 $(0.40) $ 0.28 $ 4.39 $ 2.35
Net Income (Loss) Available to MetLife, Inc.’s Common Shareholders Per Common
Share:
Basic ................................................. $ (2.89) $ 4.19 $ 5.62 $ 8.09 $ 6.21
Diluted ................................................ $ (2.89) $ 4.14 $ 5.48 $ 7.99 $ 6.16
DividendsDeclaredPerCommonShare ............................ $ 0.74 $ 0.74 $ 0.74 $ 0.59 $ 0.52
(1) On July 1, 2005, the Company completed the acquisition of The Travelers Insurance Company, excluding certain assets, most
significantly, Primerica, from Citigroup Inc. (“Citigroup”), and substantially all of Citigroup’s international insurance businesses. The
2005 selected financial data includes total revenues and total expenses of $966 million and $577 million, respectively, from the date of the
acquisition.
4MetLife, Inc.