MetLife 2009 Annual Report Download - page 48
Download and view the complete annual report
Please find page 48 of the 2009 MetLife annual report below. You can navigate through the pages in the report by either clicking on the pages listed below, or by using the keyword search tool below to find specific information within the annual report.-
 1
1 -
2
-
3
-
4
-
5
-
6
-
7
-
8
-
9
-
10
-
11
-
12
-
13
-
14
-
15
-
16
-
17
-
18
-
19
-
20
-
21
-
22
-
23
-
24
-
25
-
26
-
27
-
28
-
29
-
30
-
31
-
32
-
33
-
34
-
35
-
36
-
37
-
 38
38 -
 39
39 -
 40
40 -
 41
41 -
 42
42 -
 43
43 -
 44
44 -
 45
45 -
 46
46 -
 47
47 -
 48
48 -
 49
49 -
 50
50 -
 51
51 -
 52
52 -
 53
53 -
 54
54 -
 55
55 -
 56
56 -
 57
57 -
 58
58 -
59
-
60
-
61
-
62
-
63
-
64
-
65
-
66
-
67
-
68
-
69
-
70
-
71
-
72
-
73
-
74
-
75
-
76
-
77
-
78
-
79
-
80
-
81
-
82
-
83
-
84
-
85
-
86
-
87
-
88
-
89
-
90
-
91
-
92
-
93
-
94
-
95
-
96
-
97
-
98
-
99
-
100
-
101
-
102
-
103
-
104
-
105
-
106
-
107
-
108
-
109
-
110
-
111
-
112
-
113
-
114
-
115
-
116
-
117
-
118
-
119
-
120
-
121
-
122
-
123
-
124
-
125
-
126
-
127
-
128
-
129
-
130
-
131
-
132
-
133
-
134
-
135
-
136
-
137
-
138
-
139
-
140
-
141
-
142
-
143
-
144
-
145
-
146
-
147
-
148
-
149
-
150
-
151
-
152
-
153
-
154
-
155
-
156
-
157
-
158
-
159
-
160
-
161
-
162
-
163
-
164
-
165
-
166
-
167
-
168
-
169
-
170
-
171
-
172
-
173
-
174
-
175
-
176
-
177
-
178
-
179
-
180
-
181
-
182
-
183
-
184
-
185
-
186
-
187
-
188
-
189
-
190
-
191
-
192
-
193
-
194
-
195
-
196
-
197
-
198
-
199
-
200
-
201
-
202
-
203
-
204
-
205
-
206
-
207
-
208
-
209
-
210
-
211
-
212
-
213
-
214
-
215
-
216
-
217
-
218
-
219
-
220
 |
 |

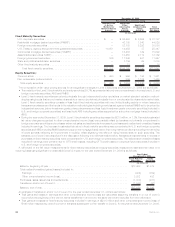
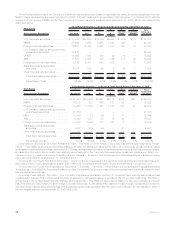
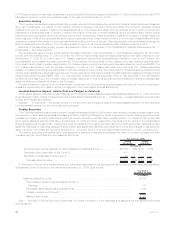
Proceeds from sales or disposals of fixed maturity and equity securities and the components of fixed maturity and equity securities net
investment gains (losses) are as follows:
2009 2008 2007 2009 2008 2007 2009 2008 2007
Years Ended December 31, Years Ended December 31, Years Ended December 31,
Fixed Maturity Securities Equity Securities Total
(In millions)
Proceeds . . . . . . . . . . . . . . . . . . . $38,972 $62,495 $78,001 $ 950 $2,107 $1,112 $39,922 $64,602 $79,113
Gross investment gains . . . . . . . . . . 947 858 554 134 440 226 1,081 1,298 780
Gross investment losses . . . . . . . . . (1,110) (1,515) (1,091) (133) (263) (43) (1,243) (1,778) (1,134)
Total OTTI losses recognized in
earnings:
Credit-related . . . . . . . . . . . . . . . (1,137) (1,138) (58) — — — (1,137) (1,138) (58)
Other(1) . . . . . . . . . . . . . . . . . . . (363) (158) (20) (400) (430) (19) (763) (588) (39)
Total OTTI losses recognized in
earnings . . . . . . . . . . . . . . . . . (1,500) (1,296) (78) (400) (430) (19) (1,900) (1,726) (97)
Net investment gains (losses) . . . . . . $ (1,663) $ (1,953) $ (615) $(399) $ (253) $ 164 $ (2,062) $ (2,206) $ (451)
(1) Other OTTI losses recognized in earnings include impairments on equity securities, impairments on perpetual hybrid securities classified
within fixed maturity securities where the primary reason for the impairment was the severity and/or the duration of an unrealized loss
position and fixed maturity securities where there is an intent to sell or it is more likely than not that the Company will be required to sell the
security before recovery of the decline in estimated fair value.
Overview of Fixed Maturity and Equity Security OTTI Losses Recognized in Earnings. Impairments of fixed maturity and equity securities
were $1.9 billion, $1.7 billion and $97 million for the years ended December 31, 2009, 2008 and 2007, respectively. Impairments of fixed
maturity securities were $1.5 billion, $1.3 billion and $78 million for the years ended December 31, 2009, 2008 and 2007, respectively.
Impairments of equity securities were $400 million, $430 million and $19 million for the years ended December 31, 2009, 2008 and 2007,
respectively.
The Company’s credit-related impairments of fixed maturity securities were $1.1 billion, $1.1 billion and $58 million for the years ended
December 31, 2009, 2008 and 2007, respectively.
The Company’s three largest impairments totaled $508 million, $528 million and $19 million for the years ended December 31, 2009, 2008
and 2007, respectively.
The Company records OTTI losses charged to earnings as investment losses and adjusts the cost basis of the fixed maturity and equity
securities accordingly. The Company does not change the revised cost basis for subsequent recoveries in value.
The Company sold or disposed of fixed maturity and equity securities at a loss that had an estimated fair value of $10.2 billion, $29.9 billion
and $47.1 billion for the years ended December 31, 2009, 2008 and 2007, respectively. Gross losses excluding impairments for fixed
maturity and equity securities were $1.2 million, $1.8 billion and $1.1 billion for the years ended December 31, 2009, 2008 and 2007,
respectively.
Explanations of changes in fixed maturity and equity securities impairments are as follows:
•Year Ended December 31, 2009 compared to the Year Ended December 31, 2008 — Overall OTTI losses recognized in earnings on
fixed maturity and equity securities were $1.9 billion for the year ended December 31, 2009 as compared to $1.7 billion in the prior year.
The stress in the global financial markets that caused a significant increase in impairments in 2008 as compared to 2007, continued into
2009. Significant impairments were incurred in several industry sectors in 2009, including the financial services industry, but to a lesser
degree in the financial services industry sector than in 2008. In 2008 certain financial institutions entered bankruptcy, entered Federal
Deposit Insurance Corporation (“FDIC”) receivership or received significant government capital infusions causing 2008 financial
services industry impairments to be higher than in 2009. Of the fixed maturity and equity securities impairments of $1,900 million in
2009, $799 million were concentrated in the Company’s financial services industry holdings and were comprised of $459 million in
impairments on fixed maturity securities and $340 million in impairments on equity securities, and the $799 million included $623 million
of perpetual hybrid securities, which were comprised of $313 million on securities classified as fixed maturity securities and $310 million
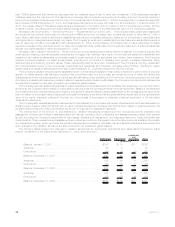
on securities classified as non-redeemable preferred stock. Overall impairments in 2009 were higher due to increased fixed maturity
security impairments across several industry sectors as presented in the tables below, which more than offset a reduction in
impairments in the financial services industry sector. Impairments across these several industry sectors increased in 2009 due to
increased financial restructurings, bankruptcy filings, ratings downgrades, collateral deterioration or difficult operating environments of
the issuers as a result of the challenging economic environment. Impairments on perpetual hybrid securities in 2009 were a result of
deterioration in the credit rating of the issuer to below investment grade and due to a severe and extended unrealized loss position.
•Year Ended December 31, 2008 compared to the Year Ended December 31, 2007 — Overall OTTI losses recognized in earnings on
fixed maturity and equity securities were $1.7 billion for the year ended December 31, 2008 as compared to $97 million in the prior year.
The significant increase in impairments of fixed maturity and equity securities in 2008 compared to 2007 was a result of the stress in the
global financial markets, particularly in the financial services industry causing an increase in financial restructurings, bankruptcy filings,
ratings downgrades, or difficult underlying operating environments for the issuers, as well as an increase in the securities that the
Company either lacked the intent to hold, or due to extensive credit spread widening, the Company was uncertain of its intent to hold
certain fixed maturity securities for a period of time sufficient to allow for recovery of the market value decline. Of the fixed maturity and
equity securities impairments of $1.7 billion in 2008, $1,014 million were concentrated in the Company’s financial services industry
securities holdings and were comprised of $673 million in impairments on fixed maturity securities and $341 million in impairments on
equity securities, and the $1,014 million included impairments of $154 million of perpetual hybrid securities, which were comprised of
$64 million on securities classified as fixed maturity securities and $90 million on securities classified as non-redeemable preferred
42 MetLife, Inc.