MetLife 2009 Annual Report Download - page 211
Download and view the complete annual report
Please find page 211 of the 2009 MetLife annual report below. You can navigate through the pages in the report by either clicking on the pages listed below, or by using the keyword search tool below to find specific information within the annual report.-
 1
1 -
2
-
3
-
4
-
5
-
6
-
7
-
8
-
9
-
10
-
11
-
12
-
13
-
14
-
15
-
16
-
17
-
18
-
19
-
20
-
21
-
22
-
23
-
24
-
25
-
26
-
27
-
28
-
29
-
30
-
31
-
32
-
33
-
34
-
35
-
36
-
37
-
38
-
39
-
40
-
41
-
42
-
43
-
44
-
45
-
46
-
47
-
48
-
49
-
50
-
51
-
52
-
53
-
54
-
55
-
56
-
57
-
58
-
59
-
60
-
61
-
62
-
63
-
64
-
65
-
66
-
67
-
68
-
69
-
70
-
71
-
72
-
73
-
74
-
75
-
76
-
77
-
78
-
79
-
80
-
81
-
82
-
83
-
84
-
85
-
86
-
87
-
88
-
89
-
90
-
91
-
92
-
93
-
94
-
95
-
96
-
97
-
98
-
99
-
100
-
101
-
102
-
103
-
104
-
105
-
106
-
107
-
108
-
109
-
110
-
111
-
112
-
113
-
114
-
115
-
116
-
117
-
118
-
119
-
120
-
121
-
122
-
123
-
124
-
125
-
126
-
127
-
128
-
129
-
130
-
131
-
132
-
133
-
134
-
135
-
136
-
137
-
138
-
139
-
140
-
141
-
142
-
143
-
144
-
145
-
146
-
147
-
148
-
149
-
150
-
151
-
152
-
153
-
154
-
155
-
156
-
157
-
158
-
159
-
160
-
161
-
162
-
163
-
164
-
165
-
166
-
167
-
168
-
169
-
170
-
171
-
172
-
173
-
174
-
175
-
176
-
177
-
178
-
179
-
180
-
181
-
182
-
183
-
184
-
185
-
186
-
187
-
188
-
189
-
190
-
191
-
192
-
193
-
194
-
195
-
196
-
197
-
198
-
199
-
200
-
 201
201 -
 202
202 -
 203
203 -
 204
204 -
 205
205 -
 206
206 -
 207
207 -
 208
208 -
 209
209 -
 210
210 -
 211
211 -
 212
212 -
 213
213 -
 214
214 -
 215
215 -
 216
216 -
 217
217 -
 218
218 -
 219
219 -
 220
220
 |
 |

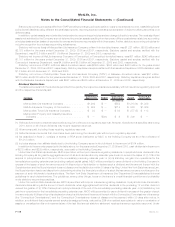
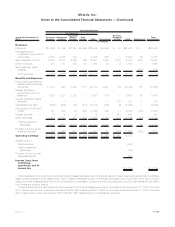
Year Ended December 31,
2007: Insurance
Products Retirement
Products
Corporate
Benefit
Funding Auto
& Home Total International
Banking,
Corporate
& Other Total Adjustments Total
Consolidated
U.S. Business
Operating Earnings
(In millions)
Revenues
Premiums . . . . . . . . . . . $15,269 $ 339 $1,265 $2,966 $19,839 $3,096 $ 35 $22,970 $ — $22,970
Universal life and
investment-type product
policy fees . . . . . . . . . 2,061 2,005 189 — 4,255 995 — 5,250 (12) 5,238
Net investment income . . . 6,079 2,740 6,636 196 15,651 1,249 1,428 18,328 (271) 18,057
Other revenues . . . . . . . . 810 181 335 43 1,369 24 72 1,465 — 1,465
Net investment gains
(losses) ........... — — — — — — — — (578) (578)
Total revenues . . . . . . . 24,219 5,265 8,425 3,205 41,114 5,364 1,535 48,013 (861) 47,152
Benefits and Expenses
Policyholder benefits and
claims and policyholder
dividends . . . . . . . . . . 17,001 605 3,365 1,811 22,782 2,521 46 25,349 157 25,506
Interest credited to
policyholder account
balances . . . . . . . . . . 1,037 1,321 2,723 — 5,081 354 — 5,435 26 5,461
Interest credited to bank
deposits . . . . . . . . . . . — — — — — — 200 200 — 200
Capitalization of DAC . . . . (885) (932) (25) (471) (2,313) (743) (8) (3,064) — (3,064)
Amortization of DAC and
VOBA . . . . . . . . . . . . . 727 822 38 468 2,055 309 11 2,375 (125) 2,250
Interest expense . . . . . . . 10 3 6 — 19 3 875 897 — 897
Other expenses . . . . . . . 4,241 2,088 477 832 7,638 2,180 328 10,146 (24) 10,122
Total benefits and
expenses . . . . . . . . . 22,131 3,907 6,584 2,640 35,262 4,624 1,452 41,338 34 41,372
Provision for income tax
expense (benefit) . . . . . 714 469 631 139 1,953 172 (157) 1,968 (293) 1,675
Operating earnings . . . . $ 1,374 $ 889 $1,210 $ 426 $ 3,899 $ 568 $ 240 4,707
Adjustments to:
Total revenues . . . . . . . (861)
Total benefits and
expenses......... (34)
Provision for income tax
(expense) benefit . . . . . 293
Income (loss) from
continuing
operations, net of
income tax ........ $ 4,105 $ 4,105
Net investment income and net investment gains (losses) are based upon the actual results of each segment’s specifically identifiable
asset portfolio adjusted for allocated equity. Other costs are allocated to each of the segments based upon: (i) a review of the nature of such
costs; (ii) time studies analyzing the amount of employee compensation costs incurred by each segment; and (iii) cost estimates included in
the Company’s product pricing.
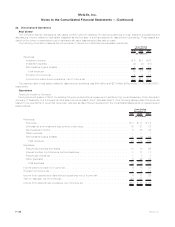
Revenues derived from any customer did not exceed 10% of consolidated revenues for the years ended December 31, 2009, 2008 and
2007. Revenues from U.S. operations were $35.9 billion, $44.6 billion and $41.7 billion for the years ended December 31, 2009, 2008 and
2007, respectively, which represented 87%, 87% and 88%, respectively, of consolidated revenues.
F-127MetLife, Inc.
MetLife, Inc.
Notes to the Consolidated Financial Statements — (Continued)