MetLife 2009 Annual Report Download - page 117
Download and view the complete annual report
Please find page 117 of the 2009 MetLife annual report below. You can navigate through the pages in the report by either clicking on the pages listed below, or by using the keyword search tool below to find specific information within the annual report.-
 1
1 -
2
-
3
-
4
-
5
-
6
-
7
-
8
-
9
-
10
-
11
-
12
-
13
-
14
-
15
-
16
-
17
-
18
-
19
-
20
-
21
-
22
-
23
-
24
-
25
-
26
-
27
-
28
-
29
-
30
-
31
-
32
-
33
-
34
-
35
-
36
-
37
-
38
-
39
-
40
-
41
-
42
-
43
-
44
-
45
-
46
-
47
-
48
-
49
-
50
-
51
-
52
-
53
-
54
-
55
-
56
-
57
-
58
-
59
-
60
-
61
-
62
-
63
-
64
-
65
-
66
-
67
-
68
-
69
-
70
-
71
-
72
-
73
-
74
-
75
-
76
-
77
-
78
-
79
-
80
-
81
-
82
-
83
-
84
-
85
-
86
-
87
-
88
-
89
-
90
-
91
-
92
-
93
-
94
-
95
-
96
-
97
-
98
-
99
-
100
-
101
-
102
-
103
-
104
-
105
-
106
-
 107
107 -
 108
108 -
 109
109 -
 110
110 -
 111
111 -
 112
112 -
 113
113 -
 114
114 -
 115
115 -
 116
116 -
 117
117 -
 118
118 -
 119
119 -
 120
120 -
 121
121 -
 122
122 -
 123
123 -
 124
124 -
 125
125 -
 126
126 -
 127
127 -
128
-
129
-
130
-
131
-
132
-
133
-
134
-
135
-
136
-
137
-
138
-
139
-
140
-
141
-
142
-
143
-
144
-
145
-
146
-
147
-
148
-
149
-
150
-
151
-
152
-
153
-
154
-
155
-
156
-
157
-
158
-
159
-
160
-
161
-
162
-
163
-
164
-
165
-
166
-
167
-
168
-
169
-
170
-
171
-
172
-
173
-
174
-
175
-
176
-
177
-
178
-
179
-
180
-
181
-
182
-
183
-
184
-
185
-
186
-
187
-
188
-
189
-
190
-
191
-
192
-
193
-
194
-
195
-
196
-
197
-
198
-
199
-
200
-
201
-
202
-
203
-
204
-
205
-
206
-
207
-
208
-
209
-
210
-
211
-
212
-
213
-
214
-
215
-
216
-
217
-
218
-
219
-
220
 |
 |

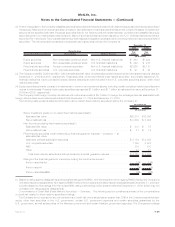
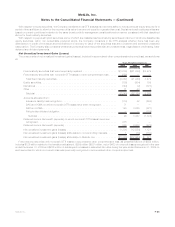
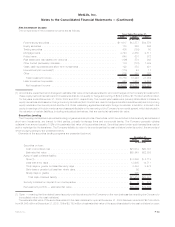
The following table presents the types of and certain other information about ABS held by the Company at:
Estimated
Fair
Value %of
Total
Estimated
Fair
Value %of
Total
2009 2008
December 31,
(In millions)
By collateral type:
Creditcardloans ....................................... $ 7,057 53.6% $ 5,190 49.3%
Studentloans.......................................... 1,855 14.1 1,085 10.3
RMBS backed by sub-prime mortgage loans . . . . . . . . . . . . . . . . . . . . . . 1,044 7.9 1,142 10.9
Automobileloans ....................................... 963 7.3 1,051 10.0
Otherloans........................................... 2,243 17.1 2,055 19.5
Total . . . . . . . . . . . . . . . . . . . . . . . . . . . . . . . . . . . . . . . . . . . . . . $13,162 100.0% $10,523 100.0%
Portion rated Aaa/AAA(1) . . . . . . . . . . . . . . . . . . . . . . . . . . . . . . . . . . . . $ 9,354 71.1% $ 7,934 75.4%
PortionratedNAIC1(2)..................................... $11,573 87.9% $ 9,393 89.3%
RMBS backed by sub-prime mortgage loans — portion credit enhanced by
financialguarantorinsurers................................ 37.6% 37.2%
Of the 37.6% and 37.2% credit enhanced, the financial guarantor insurers
were rated as follows:
ByfinancialguarantorinsurersratedAa/AA ..................... 17.2% 18.8%
ByfinancialguarantorinsurersratedA ........................ 7.9% —%
ByfinancialguarantorinsurersratedBaa/BBB ................... —% 37.3%
(1) Based on rating agency designations, without adjustment for the revised NAIC methodology which became effective December 31,
2009.
(2) Based on rating agency designations and equivalent ratings of the NAIC, with the exception of non-agency RMBS backed by sub-prime
mortgage loans held by the Company’s domestic insurance subsidiaries. Non-agency RMBS backed by sub-prime mortgage loans held
by the Company’s domestic insurance subsidiaries at December 31, 2009 are included based on final ratings from the revised NAIC
rating methodology which became effective December 31, 2009 (which may not correspond to rating agency designations).
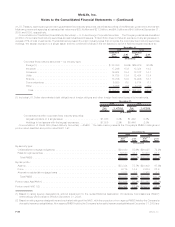
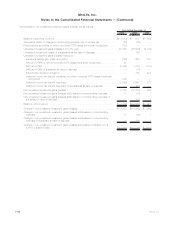
The following tables present the Company’s holdings of ABS supported by sub-prime mortgage loans by rating agency designations and
byvintageyearat:
Cost or
Amortized
Cost
Estimated
Fair
Value
Cost or
Amortized
Cost
Estimated
Fair
Value
Cost or
Amortized
Cost
Estimated
Fair
Value
Cost or
Amortized
Cost
Estimated
Fair
Value
Cost or
Amortized
Cost
Estimated
Fair
Value
Cost or
Amortized
Cost
Estimated
Fair
Value
Aaa Aa A Baa
Below
Investment
Grade Total
December 31, 2009
(In millions)
2003 & Prior . . . $ 57 $ 48 $ 73 $ 58 $11 $ 8 $ 7 $ 6 $ 98 $ 56 $ 246 $ 176
2004 . . . . . . . . 99 68 316 222 39 27 24 15 31 15 509 347
2005 . . . . . . . . 64 45 226 144 40 26 24 18 209 139 563 372
2006 . . . . . . . . 6 6 62 22 — — 22 5 115 72 205 105
2007 . . . . . . . . — — 78 28 — — — — 36 16 114 44
2008 . . . . . . . . — — — — — — — — — — — —
2009 . . . . . . . . — — — — — — — — — — — —
Total . . . . . . . $226 $ 167 $755 $ 474 $90 $ 61 $77 $ 44 $489 $ 298 $1,637 $1,044
Ratings
Distribution . . . 16.0% 45.4% 5.8% 4.2% 28.6% 100.0%
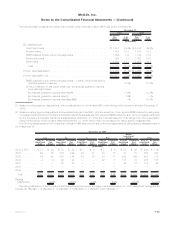
The rating distribution of the Company’s ABS supported by sub-prime mortgage loans at December 31, 2009 using NAIC ratings are as
follows: 69.1% NAIC 1, 4.2% NAIC 2, 12.2% NAIC 3, 6.2% NAIC 4, 8.3% NAIC 5 and 0% NAIC 6.
F-33MetLife, Inc.
MetLife, Inc.
Notes to the Consolidated Financial Statements — (Continued)