MetLife 2009 Annual Report Download - page 46
Download and view the complete annual report
Please find page 46 of the 2009 MetLife annual report below. You can navigate through the pages in the report by either clicking on the pages listed below, or by using the keyword search tool below to find specific information within the annual report.-
 1
1 -
2
-
3
-
4
-
5
-
6
-
7
-
8
-
9
-
10
-
11
-
12
-
13
-
14
-
15
-
16
-
17
-
18
-
19
-
20
-
21
-
22
-
23
-
24
-
25
-
26
-
27
-
28
-
29
-
30
-
31
-
32
-
33
-
34
-
35
-
 36
36 -
 37
37 -
 38
38 -
 39
39 -
 40
40 -
 41
41 -
 42
42 -
 43
43 -
 44
44 -
 45
45 -
 46
46 -
 47
47 -
 48
48 -
 49
49 -
 50
50 -
 51
51 -
 52
52 -
 53
53 -
 54
54 -
 55
55 -
 56
56 -
57
-
58
-
59
-
60
-
61
-
62
-
63
-
64
-
65
-
66
-
67
-
68
-
69
-
70
-
71
-
72
-
73
-
74
-
75
-
76
-
77
-
78
-
79
-
80
-
81
-
82
-
83
-
84
-
85
-
86
-
87
-
88
-
89
-
90
-
91
-
92
-
93
-
94
-
95
-
96
-
97
-
98
-
99
-
100
-
101
-
102
-
103
-
104
-
105
-
106
-
107
-
108
-
109
-
110
-
111
-
112
-
113
-
114
-
115
-
116
-
117
-
118
-
119
-
120
-
121
-
122
-
123
-
124
-
125
-
126
-
127
-
128
-
129
-
130
-
131
-
132
-
133
-
134
-
135
-
136
-
137
-
138
-
139
-
140
-
141
-
142
-
143
-
144
-
145
-
146
-
147
-
148
-
149
-
150
-
151
-
152
-
153
-
154
-
155
-
156
-
157
-
158
-
159
-
160
-
161
-
162
-
163
-
164
-
165
-
166
-
167
-
168
-
169
-
170
-
171
-
172
-
173
-
174
-
175
-
176
-
177
-
178
-
179
-
180
-
181
-
182
-
183
-
184
-
185
-
186
-
187
-
188
-
189
-
190
-
191
-
192
-
193
-
194
-
195
-
196
-
197
-
198
-
199
-
200
-
201
-
202
-
203
-
204
-
205
-
206
-
207
-
208
-
209
-
210
-
211
-
212
-
213
-
214
-
215
-
216
-
217
-
218
-
219
-
220
 |
 |
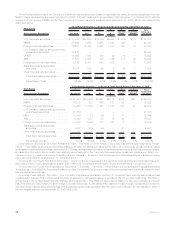
holdings of commercial real estate collateralized debt obligations securities were $111 million and $121 million of estimated fair value at
December 31, 2009 and 2008, respectively. The weighted average credit enhancement of the Company’s CMBS holdings was 28% and
26%, at December 31, 2009 and 2008, respectively. This credit enhancement percentage represents the current weighted average
estimated percentage of outstanding capital structure subordinated to the Company’s investment holding that is available to absorb losses
before the security incurs the first dollar of loss of principal. The credit protection does not include any equity interest or property value in
excess of outstanding debt.
See Note 3 of the Notes to the Consolidated Financial Statements “Investments — Fixed Maturity Securities Available-for-Sale — CMBS”
for tables that present the Company’s holdings of CMBS by rating agency designations and by vintage year at December 31, 2009 and 2008.
ABS. The Company’s ABS are diversified both by sector and by issuer. See Note 3 of the Notes to the Consolidated Financial Statements
“Investments — Fixed Maturity Securities Available-for-Sale Concentrations of Credit Risk (Fixed Maturity Securities) — ABS” for a table that
presents the Company’s ABS by collateral type, portion rated Aaa/AAA and portion credit enhanced held by the Company at December 31,
2009 and 2008.
The slowing U.S. housing market, greater use of affordable mortgage products and relaxed underwriting standards for some originators of
sub-prime loans have recently led to higher delinquency and loss rates, especially within the 2006 and 2007 vintage years. Vintage year refers
to the year of origination and not to the year of purchase. These factors have caused a pull-back in market liquidity and repricing of risk, which
has led to higher levels of unrealized losses on securities backed by sub-prime mortgage loans as compared to historical levels. However, in
2009, market conditions improved, credit spreads narrowed and unrealized losses decreased from 39% to 36% of cost or amortized cost
from December 31, 2008 to December 31, 2009. Based upon the analysis of the Company’s sub-prime mortgage loans through its exposure
to ABS, the Company expects to receive payments in accordance with the contractual terms of the securities that are considered temporarily
impaired. Any securities where the present value of projected future cash flows expected to be collected is less than amortized cost are
impaired in accordance with our impairment policy.
See Note 3 of the Notes to the Consolidated Financial Statements “Investments— Fixed Maturity Securities Available-for-Sale — ABS” for
tables that present the Company’s holdings of ABS supported by sub-prime mortgage loans by rating agency designations and by vintage
year at December 31, 2009 and 2008.
The Company had ABS supported by sub-prime mortgage loans with estimated fair values of $1,044 million and $1,142 million,
respectively, and unrealized losses of $593 million and $730 million, respectively, at December 31, 2009 and 2008, respectively. Approx-
imately 63% of this portfolio was rated Aa or better, of which 61% was in vintage year 2005 and prior at December 31, 2009. Approximately
82% of this portfolio was rated Aa or better, of which 82% was in vintage year 2005 and prior at December 31, 2008. These older vintages
benefit from better underwriting, improved enhancement levels and higher residential property price appreciation. All of the $1,044 million and
$1,142 million of ABS supported by sub-prime mortgage loans were classified as Level 3 fixed maturity securities at December 31, 2009 and
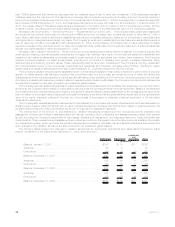
2008, respectively. The NAIC rating distribution of the Company’s ABS supported by sub-prime mortgage loans at December 31, 2009 was
as follows: 69% NAIC 1, 4% NAIC 2 and 27% NAIC 3 through 6. The NAIC rating distribution of the Company’s ABS supported by sub-prime
mortgage loans at December 31, 2008 was as follows: 87% NAIC 1, 12% NAIC 2 and 1% NAIC 3 through 6.
ABS also include collateralized debt obligations backed by sub-prime mortgage loans at an aggregate cost of $22 million with an
estimated fair value of $8 million at December 31, 2009 and an aggregate cost of $20 million with an estimated fair value of $10 million at
December 31, 2008.
Evaluating Available-for-Sale Securities for Other-Than-Temporary Impairment
SeeNote3oftheNotestotheConsolidatedFinancialStatements“Investments — Evaluating Available-for-Sale Securities for Oth-
er-Than-Temporary Impairment” for a discussion of the regular evaluation of available-for-sale securities holdings in accordance with our
impairment policy, whereby we evaluate whether such investments are other-than-temporarily impaired, new OTTI guidance adopted in 2009
and factors considered by security classification in the regular OTTI evaluation.
See “— Summary of Critical Accounting Estimates.”
Net Unrealized Investment Gains (Losses)
SeeNote3oftheNotestotheConsolidatedFinancialStatements“Investments — Net Unrealized Investment Gains (Losses)” for the
components of net unrealized investment gains (losses), included in accumulated other comprehensive loss and the changes in net
unrealized investment gains (losses) at December 31, 2009 and 2008 and for the years ended December 31, 2009, 2008 and 2007,
respectively.
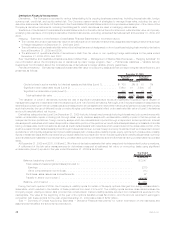
Fixed maturity securities with noncredit OTTI losses in accumulated other comprehensive loss of $859 million, includes $126 million
related to the transition adjustment, $939 million ($857 million, net of DAC) of noncredit losses recognized in the year ended December 31,
2009 and $206 million of subsequent increases in estimated fair value during the year ended December 31, 2009 on such securities for which
a noncredit loss was previously recognized in accumulated other comprehensive loss.
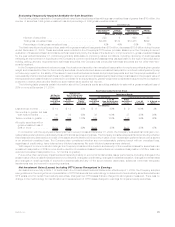
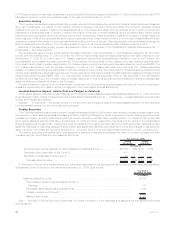
Aging of Gross Unrealized Loss and OTTI Loss for Fixed Maturity and Equity Securities Available-for-Sale
See Note 3 of the Notes to the Consolidated Financial Statements “Investments— Aging of Gross Unrealized Loss and OTTI Loss for Fixed
Maturity and Equity Securities Available-for-Sale” for the tables that present the cost or amortized cost, gross unrealized loss, including the
portion of OTTI loss on fixed maturity securities recognized in accumulated other comprehensive loss at December 31, 2009, gross
unrealized loss as a percentage of cost or amortized cost and number of securities for fixed maturity and equity securities where the estimated
fair value had declined and remained below cost or amortized cost by less than 20%, or 20% or more at December 31, 2009 and 2008.
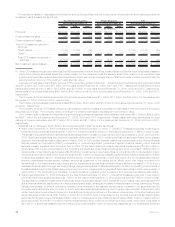
Concentration of Gross Unrealized Loss and OTTI Loss for Fixed Maturity and Equity Securities Available-for-Sale
See Note 3 of the Notes to the Consolidated Financial Statements “Investments — Concentration of Gross Unrealized Loss and OTTI Loss
for Fixed Maturity and Equity Securities Available-for-Sale” for the tables that present the concentration by sector and industry of the
Company’s gross unrealized losses related to its fixed maturity and equity securities, including the portion of OTTI loss on fixed maturity
securities recognized in accumulated other comprehensive loss of $10.8 billion and $29.8 billion at December 31, 2009 and 2008,
respectively.
40 MetLife, Inc.