MetLife 2009 Annual Report Download - page 194
Download and view the complete annual report
Please find page 194 of the 2009 MetLife annual report below. You can navigate through the pages in the report by either clicking on the pages listed below, or by using the keyword search tool below to find specific information within the annual report.-
 1
1 -
2
-
3
-
4
-
5
-
6
-
7
-
8
-
9
-
10
-
11
-
12
-
13
-
14
-
15
-
16
-
17
-
18
-
19
-
20
-
21
-
22
-
23
-
24
-
25
-
26
-
27
-
28
-
29
-
30
-
31
-
32
-
33
-
34
-
35
-
36
-
37
-
38
-
39
-
40
-
41
-
42
-
43
-
44
-
45
-
46
-
47
-
48
-
49
-
50
-
51
-
52
-
53
-
54
-
55
-
56
-
57
-
58
-
59
-
60
-
61
-
62
-
63
-
64
-
65
-
66
-
67
-
68
-
69
-
70
-
71
-
72
-
73
-
74
-
75
-
76
-
77
-
78
-
79
-
80
-
81
-
82
-
83
-
84
-
85
-
86
-
87
-
88
-
89
-
90
-
91
-
92
-
93
-
94
-
95
-
96
-
97
-
98
-
99
-
100
-
101
-
102
-
103
-
104
-
105
-
106
-
107
-
108
-
109
-
110
-
111
-
112
-
113
-
114
-
115
-
116
-
117
-
118
-
119
-
120
-
121
-
122
-
123
-
124
-
125
-
126
-
127
-
128
-
129
-
130
-
131
-
132
-
133
-
134
-
135
-
136
-
137
-
138
-
139
-
140
-
141
-
142
-
143
-
144
-
145
-
146
-
147
-
148
-
149
-
150
-
151
-
152
-
153
-
154
-
155
-
156
-
157
-
158
-
159
-
160
-
161
-
162
-
163
-
164
-
165
-
166
-
167
-
168
-
169
-
170
-
171
-
172
-
173
-
174
-
175
-
176
-
177
-
178
-
179
-
180
-
181
-
182
-
183
-
 184
184 -
 185
185 -
 186
186 -
 187
187 -
 188
188 -
 189
189 -
 190
190 -
 191
191 -
 192
192 -
 193
193 -
 194
194 -
 195
195 -
 196
196 -
 197
197 -
 198
198 -
 199
199 -
 200
200 -
 201
201 -
 202
202 -
 203
203 -
 204
204 -
205
-
206
-
207
-
208
-
209
-
210
-
211
-
212
-
213
-
214
-
215
-
216
-
217
-
218
-
219
-
220
 |
 |

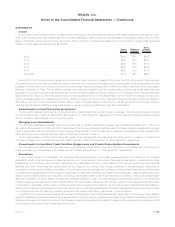
(3) Investment portfolio includes U.S. equity securities with relatively large market capitalization and no particular bias toward value or
growth.
(4) Investment portfolio includes U.S. equity securities with relatively small market capitalization that exhibit signs of above average sales
and earnings growth.
(5) Investment portfolio includes U.S. equity securities with relatively small market capitalization and no particular bias toward value or
growth.
(6) Investment portfolio includes International equity securities with relatively large market capitalization and no particular bias toward value
or growth.
(7) Investment portfolio includes longer-maturity investment-grade fixed income securities invested across diverse asset sectors such as
government, corporate and structured finance.
(8) Investment portfolio includes investment-grade fixed income securities with varying maturities invested across diverse asset sectors
such as government, corporate and structured finance.
(9) Investment portfolio includes multiple hedge funds with strategies such as fixed income arbitrage, long-short equity, tactical trading and
global macro.
(10) Investment portfolio includes domestic real estate equity investments in both privately held commercial real estate and publicly listed real
estate investment trust securities.
(11) Investment portfolio includes domestic and foreign private investments in companies not publicly traded on a stock exchange.
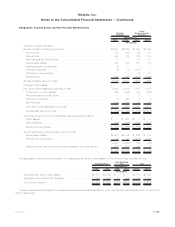
The fair values of the Subsidiaries’ pension plan assets at December 31, 2008 was $6,570 million.
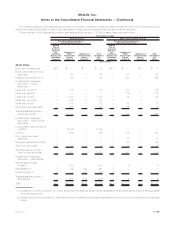
The pension plan assets are categorized into the three-level fair value hierarchy, as defined in Note 1, based upon the priority of the inputs
to the respective valuation technique. The following summarizes the types of assets included within the three-level fair value hierarchy
presented in the table above.
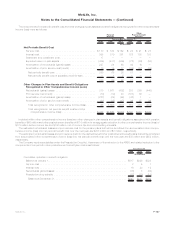
Level 1 This category includes investments in liquid securities, such as cash, short-term money market and bank time deposits,
expected to mature within a year.
Level 2 This category includes certain separate accounts that are primarily invested in liquid and readily marketable securities. The
estimated fair value of such separate account is based upon reported NAV provided by fund managers and this value represents
the amount at which transfers in and out of the respective separate account are effected. These separate accounts provide
reasonable levels of price transparency and can be corroborated through observable market data.
Certain separate accounts are invested in investment partnerships designated as hedge funds. The values for these separate
accounts is determined monthly based on the NAV of the underlying hedge fund investment. Additionally, such hedge funds
generally contain lock out or other waiting period provisions for redemption requests to be filled. While the reporting and
redemption restrictions may limit the frequency of trading activity in separate accounts invested in hedge funds, the reported
NAV, and thus the referenced value of the separate account, provides a reasonable level of price transparency that can be
corroborated through observable market data. Directly held investments are primarily invested in U.S. and foreign government
and corporate securities.
Level 3 This category includes separate accounts that are invested in real estate and private equity investments provide little or no price
transparency due to the infrequency with which the underlying assets trade and generally require additional time to liquidate in an
orderly manner. Accordingly, the values for separate accounts invested in these alternative asset classes are based on inputs
that cannot be readily derived from or corroborated by observable market data.
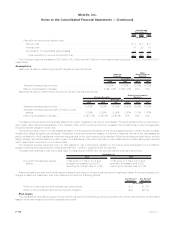
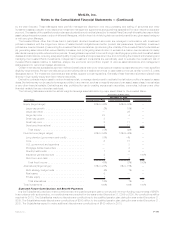
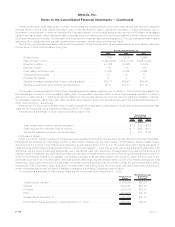
A rollforward of all assets measured at estimated fair value on a recurring basis using significant unobservable (Level 3) inputs for the year
ended December 31, 2009 is as follows:
Private Equity Funds Real Estate
Fair Value Measurement Using Significant
Unobservable Outputs (Level 3)
(In millions)
BalanceJanuary1,....................................... $430 $379
Actual return on plan assets:
Assetsheldatreportingdate ................................ (55) (137)
Assetssoldduringtheperiod................................ (33) —
Purchases,salesandsettlements ............................. 31 —
TransfersinandoutofLevel3 ............................... — —
BalanceatDecember31, .................................. $373 $242
The Subsidiaries provide employees with benefits under various ERISA benefit plans. These include qualified pension plans, postre-
tirement medical plans and certain retiree life insurance coverage. The assets of MetLife’s qualified pension plans are held in insurance group
annuity contracts, and the vast majority of the assets of the postretirement medical plan and backing the retiree life coverage are held in
insurance contracts. All of these contracts are issued by Company insurance affiliates, and the assets under the contracts are held in
insurance separate accounts that have been established by the Company. The insurance contract provider engages investment manage-
ment firms (“Managers”) to serve as sub-advisors for the separate accounts based on the specific investment needs and requests identified
F-110 MetLife, Inc.
MetLife, Inc.
Notes to the Consolidated Financial Statements — (Continued)