MetLife 2009 Annual Report Download - page 135
Download and view the complete annual report
Please find page 135 of the 2009 MetLife annual report below. You can navigate through the pages in the report by either clicking on the pages listed below, or by using the keyword search tool below to find specific information within the annual report.-
 1
1 -
2
-
3
-
4
-
5
-
6
-
7
-
8
-
9
-
10
-
11
-
12
-
13
-
14
-
15
-
16
-
17
-
18
-
19
-
20
-
21
-
22
-
23
-
24
-
25
-
26
-
27
-
28
-
29
-
30
-
31
-
32
-
33
-
34
-
35
-
36
-
37
-
38
-
39
-
40
-
41
-
42
-
43
-
44
-
45
-
46
-
47
-
48
-
49
-
50
-
51
-
52
-
53
-
54
-
55
-
56
-
57
-
58
-
59
-
60
-
61
-
62
-
63
-
64
-
65
-
66
-
67
-
68
-
69
-
70
-
71
-
72
-
73
-
74
-
75
-
76
-
77
-
78
-
79
-
80
-
81
-
82
-
83
-
84
-
85
-
86
-
87
-
88
-
89
-
90
-
91
-
92
-
93
-
94
-
95
-
96
-
97
-
98
-
99
-
100
-
101
-
102
-
103
-
104
-
105
-
106
-
107
-
108
-
109
-
110
-
111
-
112
-
113
-
114
-
115
-
116
-
117
-
118
-
119
-
120
-
121
-
122
-
123
-
124
-
 125
125 -
 126
126 -
 127
127 -
 128
128 -
 129
129 -
 130
130 -
 131
131 -
 132
132 -
 133
133 -
 134
134 -
 135
135 -
 136
136 -
 137
137 -
 138
138 -
 139
139 -
 140
140 -
 141
141 -
 142
142 -
 143
143 -
 144
144 -
 145
145 -
146
-
147
-
148
-
149
-
150
-
151
-
152
-
153
-
154
-
155
-
156
-
157
-
158
-
159
-
160
-
161
-
162
-
163
-
164
-
165
-
166
-
167
-
168
-
169
-
170
-
171
-
172
-
173
-
174
-
175
-
176
-
177
-
178
-
179
-
180
-
181
-
182
-
183
-
184
-
185
-
186
-
187
-
188
-
189
-
190
-
191
-
192
-
193
-
194
-
195
-
196
-
197
-
198
-
199
-
200
-
201
-
202
-
203
-
204
-
205
-
206
-
207
-
208
-
209
-
210
-
211
-
212
-
213
-
214
-
215
-
216
-
217
-
218
-
219
-
220
 |
 |

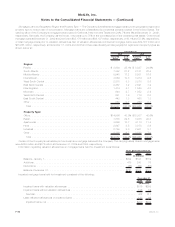
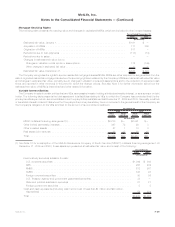
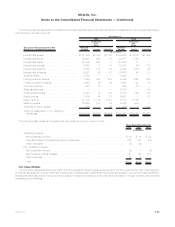
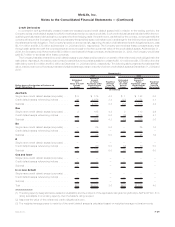
Primary Risks Managed by Derivative Financial Instruments and Non-Derivative Financial Instruments
The Company is exposed to various risks relating to its ongoing business operations, including interest rate risk, foreign currency risk,
credit risk and equity market risk. The Company uses a variety of strategies to manage these risks, including the use of derivative instruments.
The following table presents the notional amount, estimated fair value and primary underlying risk exposure of the Company’s derivative
financial instruments, excluding embedded derivatives held at:
Primary Underlying
Risk Exposure Instrument Type Notional
Amount Assets Liabilities Notional
Amount Assets Liabilities
Estimated
Fair Value(1) Estimated
Fair Value(1)
2009 2008
December 31,
(In millions)
Interest rate Interest rate swaps . . . . . . . . . . . . . . . . . . $ 38,152 $1,570 $1,255 $ 34,060 $ 4,617 $1,468
Interest rate floors . . . . . . . . . . . . . . . . . . 23,691 461 37 48,517 1,748 —
Interestratecaps................... 28,409 283 — 24,643 11 —
Interestratefutures.................. 7,563 8 10 13,851 44 117
Interest rate options . . . . . . . . . . . . . . . . . 4,050 117 57 2,365 939 35
Interest rate forwards . . . . . . . . . . . . . . . . 9,921 66 27 16,616 49 70
SyntheticGICs .................... 4,352 — — 4,260 — —
Foreign currency Foreign currency swaps . . . . . . . . . . . . . . . 16,879 1,514 1,392 19,438 1,953 1,866
Foreign currency forwards . . . . . . . . . . . . . 6,485 83 57 5,167 153 129
Currencyoptions................... 822 18 — 932 73 —
Non-derivative hedging instruments(2) . . . . . — — — 351 — 323
Credit Swapspreadlocks .................. — — — 2,338 — 99
Credit default swaps . . . . . . . . . . . . . . . . . 6,723 74 130 5,219 152 69
Creditforwards .................... 220 2 6 — — —
Equitymarket Equityfutures ..................... 7,405 44 21 6,057 1 88
Equity options . . . . . . . . . . . . . . . . . . . . . 27,175 1,712 1,018 5,153 2,150 —
Varianceswaps.................... 13,654 181 58 9,222 416 —
Totalrateofreturnswaps.............. 376 — 47 250 — 101
Total.......................... $195,877 $6,133 $4,115 $198,439 $12,306 $4,365
(1) The estimated fair value of all derivatives in an asset position is reported within other invested assets in the consolidated balance sheets
and the estimated fair value of all derivatives in a liability position is reported within other liabilities in the consolidated balance sheets.
(2) The estimated fair value of non-derivative hedging instruments represents the amortized cost of the instruments, as adjusted for foreign
currency transaction gains or losses. Non-derivative hedging instruments are reported within policyholder account balances in the
consolidated balance sheets.
F-51MetLife, Inc.
MetLife, Inc.
Notes to the Consolidated Financial Statements — (Continued)