MetLife 2009 Annual Report Download - page 54
Download and view the complete annual report
Please find page 54 of the 2009 MetLife annual report below. You can navigate through the pages in the report by either clicking on the pages listed below, or by using the keyword search tool below to find specific information within the annual report.-
 1
1 -
2
-
3
-
4
-
5
-
6
-
7
-
8
-
9
-
10
-
11
-
12
-
13
-
14
-
15
-
16
-
17
-
18
-
19
-
20
-
21
-
22
-
23
-
24
-
25
-
26
-
27
-
28
-
29
-
30
-
31
-
32
-
33
-
34
-
35
-
36
-
37
-
38
-
39
-
40
-
41
-
42
-
43
-
 44
44 -
 45
45 -
 46
46 -
 47
47 -
 48
48 -
 49
49 -
 50
50 -
 51
51 -
 52
52 -
 53
53 -
 54
54 -
 55
55 -
 56
56 -
 57
57 -
 58
58 -
 59
59 -
 60
60 -
 61
61 -
 62
62 -
 63
63 -
 64
64 -
65
-
66
-
67
-
68
-
69
-
70
-
71
-
72
-
73
-
74
-
75
-
76
-
77
-
78
-
79
-
80
-
81
-
82
-
83
-
84
-
85
-
86
-
87
-
88
-
89
-
90
-
91
-
92
-
93
-
94
-
95
-
96
-
97
-
98
-
99
-
100
-
101
-
102
-
103
-
104
-
105
-
106
-
107
-
108
-
109
-
110
-
111
-
112
-
113
-
114
-
115
-
116
-
117
-
118
-
119
-
120
-
121
-
122
-
123
-
124
-
125
-
126
-
127
-
128
-
129
-
130
-
131
-
132
-
133
-
134
-
135
-
136
-
137
-
138
-
139
-
140
-
141
-
142
-
143
-
144
-
145
-
146
-
147
-
148
-
149
-
150
-
151
-
152
-
153
-
154
-
155
-
156
-
157
-
158
-
159
-
160
-
161
-
162
-
163
-
164
-
165
-
166
-
167
-
168
-
169
-
170
-
171
-
172
-
173
-
174
-
175
-
176
-
177
-
178
-
179
-
180
-
181
-
182
-
183
-
184
-
185
-
186
-
187
-
188
-
189
-
190
-
191
-
192
-
193
-
194
-
195
-
196
-
197
-
198
-
199
-
200
-
201
-
202
-
203
-
204
-
205
-
206
-
207
-
208
-
209
-
210
-
211
-
212
-
213
-
214
-
215
-
216
-
217
-
218
-
219
-
220
 |
 |

Derivative Financial Instruments
Derivatives. The Company is exposed to various risks relating to its ongoing business operations, including interest rate risk, foreign
currency risk, credit risk, and equity market risk. The Company uses a variety of strategies to manage these risks, including the use of
derivative instruments. See Note 4 of the Notes to the Consolidated Financial Statements for a comprehensive description of the nature of the
Company’s derivative instruments, including the strategies for which derivatives are used in managing various risks.
See Note 4 of the Notes to Consolidated Financial Statements for information about the notional amount, estimated fair value, and primary
underlying risk exposure of Company’s derivative financial instruments, excluding embedded derivatives held at December 31, 2009 and
2008.
Hedging. See Note 4 of the Notes to Consolidated Financial Statements for information about:
• The notional amount and estimated fair value of derivatives and non-derivative instruments designated as hedging instruments by type
of hedge designation at December 31, 2009 and 2008.
• The notional amount and estimated fair value of derivatives that are not designated or do not qualify as hedging instruments by derivative
type at December 31, 2009 and 2008.
• The statement of operations effects of derivatives in cash flow, fair value, or non-qualifying hedge relationships for the years ended
December 31, 2009, 2008, and 2007.
See “Quantitative and Qualitative Disclosures About Market Risk — Management of Market Risk Exposures — Hedging Activities” for
more information about the Company’s use of derivatives by major hedge program. See “— Policyholder Liabilities — Variable Annuity
Guarantees” for information about the Company’s use of derivatives to hedge variable annuity guarantees.
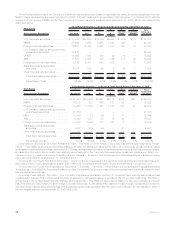
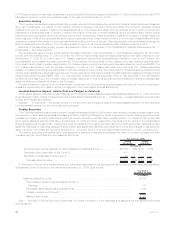
Fair Value Hierarchy. Derivatives measured at estimated fair value on a recurring basis and their corresponding fair value hierarchy, are
presented as follows:
Derivative
Assets Derivative
Liabilities
December 31, 2009
(In millions)
Quoted prices in active markets for identical assets and liabilities (Level 1) . . . . . . . . . $ 103 2% $ 51 1%
Significantotherobservableinputs(Level2) ............................ 5,600 91 3,990 97
Significantunobservableinputs(Level3)............................... 430 7 74 2
Totalestimatedfairvalue ....................................... $6,133 100% $4,115 100%
The valuation of Level 3 derivatives involves the use of significant unobservable inputs and generally requires a higher degree of
management judgment or estimation than the valuations of Level 1 and Level 2 derivatives. Although Level 3 inputs are based on assumptions
deemed appropriate given the circumstances and are assumed to be consistent with what other market participants would use when pricing
such instruments, the use of different inputs or methodologies could have a material effect on the estimated fair value of Level 3 derivatives
and could materially affect net income.
Derivatives categorized as Level 3 at December 31, 2009 include: interest rate forwards including interest rate lock commitments with
certain unobservable inputs, including pull-through rates; equity variance swaps with unobservable volatility inputs or that are priced via
independent broker quotations; foreign currency swaps which are cancelable and priced through independent broker quotations; interest
rate swaps with maturities which extend beyond the observable portion of the yield curve; credit default swaps based upon baskets of credits
having unobservable credit correlations, as well as credit default swaps with maturities which extend beyond the observable portion of the
credit curves and credit default swaps priced through independent broker quotes; foreign currency forwards priced via independent broker
quotations or with liquidity adjustments; implied volatility swaps with unobservable volatility inputs; equity options with unobservable volatility
inputs; interest rate caps and floors referencing unobservable yield curves and/or which include liquidity and volatility adjustments; currency
options based upon baskets of currencies having unobservable currency correlations; and credit forwards having unobservable repurchase
rates.
At December 31, 2009 and 2008, 5.5% and 2.7% of the net derivative estimated fair value was priced via independent broker quotations.
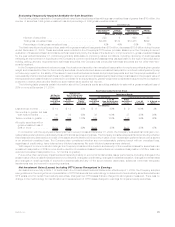
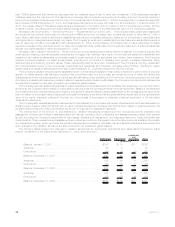
A rollforward of the fair value measurements for derivatives measured at estimated fair value on a recurring basis using significant
unobservable (Level 3) inputs for the year ended December 31, 2009 is as follows:
Year Ended
December 31, 2009
(In millions)
Balance,beginningofperiod................................................ $2,547
Total realized/unrealized gains (losses) included in:
Earnings .......................................................... (273)
Othercomprehensiveincome(loss)......................................... (11)
Purchases,sales,issuancesandsettlements.................................... 97
Transferinand/oroutofLevel3 ............................................ (2,004)
Balance,endofperiod.................................................... $ 356
During the fourth quarter of 2009, the Company’s volatility inputs for certain of its equity options changed from being unobservable to
observable, which resulted in the transfer of these positions from level 3 to level 2. The volatility inputs became observable because the
Company began utilizing a market data provider that constructs an implied volatility surface sourced from transactions executed in the
marketplace. The value at the beginning of the year of the options transferred was $2.0 billion, and the amount recorded in earnings in
connection with these options for the year ended December 31, 2009 was a loss of $762 million.
See “— Summary of Critical Accounting Estimates — Derivative Financial Instruments” for further information on the estimates and
assumptions that affect the amounts reported above.
48 MetLife, Inc.