MetLife 2009 Annual Report Download - page 158
Download and view the complete annual report
Please find page 158 of the 2009 MetLife annual report below. You can navigate through the pages in the report by either clicking on the pages listed below, or by using the keyword search tool below to find specific information within the annual report.-
 1
1 -
2
-
3
-
4
-
5
-
6
-
7
-
8
-
9
-
10
-
11
-
12
-
13
-
14
-
15
-
16
-
17
-
18
-
19
-
20
-
21
-
22
-
23
-
24
-
25
-
26
-
27
-
28
-
29
-
30
-
31
-
32
-
33
-
34
-
35
-
36
-
37
-
38
-
39
-
40
-
41
-
42
-
43
-
44
-
45
-
46
-
47
-
48
-
49
-
50
-
51
-
52
-
53
-
54
-
55
-
56
-
57
-
58
-
59
-
60
-
61
-
62
-
63
-
64
-
65
-
66
-
67
-
68
-
69
-
70
-
71
-
72
-
73
-
74
-
75
-
76
-
77
-
78
-
79
-
80
-
81
-
82
-
83
-
84
-
85
-
86
-
87
-
88
-
89
-
90
-
91
-
92
-
93
-
94
-
95
-
96
-
97
-
98
-
99
-
100
-
101
-
102
-
103
-
104
-
105
-
106
-
107
-
108
-
109
-
110
-
111
-
112
-
113
-
114
-
115
-
116
-
117
-
118
-
119
-
120
-
121
-
122
-
123
-
124
-
125
-
126
-
127
-
128
-
129
-
130
-
131
-
132
-
133
-
134
-
135
-
136
-
137
-
138
-
139
-
140
-
141
-
142
-
143
-
144
-
145
-
146
-
147
-
 148
148 -
 149
149 -
 150
150 -
 151
151 -
 152
152 -
 153
153 -
 154
154 -
 155
155 -
 156
156 -
 157
157 -
 158
158 -
 159
159 -
 160
160 -
 161
161 -
 162
162 -
 163
163 -
 164
164 -
 165
165 -
 166
166 -
 167
167 -
 168
168 -
169
-
170
-
171
-
172
-
173
-
174
-
175
-
176
-
177
-
178
-
179
-
180
-
181
-
182
-
183
-
184
-
185
-
186
-
187
-
188
-
189
-
190
-
191
-
192
-
193
-
194
-
195
-
196
-
197
-
198
-
199
-
200
-
201
-
202
-
203
-
204
-
205
-
206
-
207
-
208
-
209
-
210
-
211
-
212
-
213
-
214
-
215
-
216
-
217
-
218
-
219
-
220
 |
 |

Net
Investment
Income
Net
Investment
Gains
(Losses) Other
Revenues
Policyholder
Benefits and
Claims Other
Expenses Total
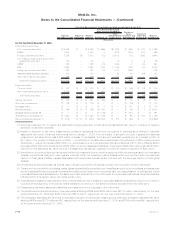
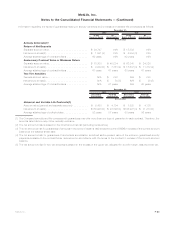
Classification of Realized/Unrealized Gains
(Losses) included in Earnings
Total G ain s and Los ses
(In millions)
For the Year Ended December 31, 2008:
Fixed maturity securities:
U.S.corporatesecurities........................ $ 15 $ (711) $ — $ — $— $ (696)
RMBS.................................... 3 1 — — — 4
Foreigncorporatesecurities...................... 123 (135) — — — (12)
U.S. Treasury, agency and government guaranteed
securities ................................ — — — — — —
CMBS.................................... 4 (76) — — — (72)
ABS ..................................... 4 (129) — — — (125)
Foreigngovernmentsecurities .................... 27 (8) — — — 19
Stateandpoliticalsubdivisionsecurities.............. (1) 1 — — — —
Otherfixedmaturitysecurities..................... 1 — — — — 1
Totalfixedmaturitysecurities.................... $176 $(1,057) $ — $ — $— $ (881)
Equity securities:
Commonstock .............................. $ — $ (2) $ — $ — $— $ (2)
Non-redeemablepreferredstock................... — (195) — — — (195)
Totalequitysecurities......................... $ — $ (197) $ — $ — $— $ (197)
Tradingsecurities.............................. $(26) $ — $ — $ — $— $ (26)
Short-terminvestments .......................... $ 1 $ (1) $ — $ — $— $ —
Mortgageloans ............................... $ — $ — $ 4 $ — $— $ 4
Netderivatives................................ $103 $1,587 $ 39 $ — $— $1,729
Mortgage servicing rights . . . . . . . . . . . . . . . . . . . . . . . . . $ — $ — $(149) $ — $— $ (149)
Netembeddedderivatives ........................ $ — $(2,682) $ — $182 $— $(2,500)
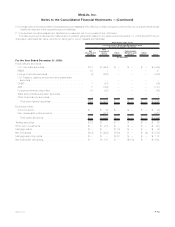
The table below summarizes the portion of unrealized gains and losses recorded in earnings for the years ended December 31, 2009 and
2008 for Level 3 assets and liabilities that were still held at December 31, 2009 and 2008, respectively.
Net
Investment
Income
Net
Investment
Gains
(Losses) Other
Revenues
Policyholder
Benefits and
Claims Other
Expenses Total
Changes in Unrealized Gains (Losses)
Relating to Assets and Liabilities Held at December 31, 2009
(In millions)
For the Year Ended December 31, 2009:
Fixed maturity securities:
U.S.corporatesecurities ........................ $18 $ (412) $ — $ — $ — $ (394)
RMBS .................................... 30 6 — — — 36
Foreigncorporatesecurities ...................... (3) (176) — — — (179)
U.S. Treasury, agency and government guaranteed
securities................................. — — — — — —
CMBS .................................... 1 (61) — — — (60)
ABS...................................... 8 (136) — — — (128)
Foreigngovernmentsecurities..................... 11 — — — — 11
Stateandpoliticalsubdivisionsecurities .............. — — — — — —
Otherfixedmaturitysecurities..................... 1 — — — — 1
Totalfixedmaturitysecurities .................... $66 $ (779) $ — $ — $ — $ (713)
Equity securities:
Commonstock............................... $— $ (1) $ — $ — $ — $ (1)
Non-redeemablepreferredstock ................... — (168) — — — (168)
Totalequitysecurities......................... $— $ (169) $ — $ — $ — $ (169)
F-74 MetLife, Inc.
MetLife, Inc.
Notes to the Consolidated Financial Statements — (Continued)