MetLife 2009 Annual Report Download - page 9
Download and view the complete annual report
Please find page 9 of the 2009 MetLife annual report below. You can navigate through the pages in the report by either clicking on the pages listed below, or by using the keyword search tool below to find specific information within the annual report.-
 1
1 -
 2
2 -
 3
3 -
 4
4 -
 5
5 -
 6
6 -
 7
7 -
 8
8 -
 9
9 -
 10
10 -
 11
11 -
 12
12 -
 13
13 -
 14
14 -
 15
15 -
 16
16 -
 17
17 -
 18
18 -
 19
19 -
 20
20 -
21
-
22
-
23
-
24
-
25
-
26
-
27
-
28
-
29
-
30
-
31
-
32
-
33
-
34
-
35
-
36
-
37
-
38
-
39
-
40
-
41
-
42
-
43
-
44
-
45
-
46
-
47
-
48
-
49
-
50
-
51
-
52
-
53
-
54
-
55
-
56
-
57
-
58
-
59
-
60
-
61
-
62
-
63
-
64
-
65
-
66
-
67
-
68
-
69
-
70
-
71
-
72
-
73
-
74
-
75
-
76
-
77
-
78
-
79
-
80
-
81
-
82
-
83
-
84
-
85
-
86
-
87
-
88
-
89
-
90
-
91
-
92
-
93
-
94
-
95
-
96
-
97
-
98
-
99
-
100
-
101
-
102
-
103
-
104
-
105
-
106
-
107
-
108
-
109
-
110
-
111
-
112
-
113
-
114
-
115
-
116
-
117
-
118
-
119
-
120
-
121
-
122
-
123
-
124
-
125
-
126
-
127
-
128
-
129
-
130
-
131
-
132
-
133
-
134
-
135
-
136
-
137
-
138
-
139
-
140
-
141
-
142
-
143
-
144
-
145
-
146
-
147
-
148
-
149
-
150
-
151
-
152
-
153
-
154
-
155
-
156
-
157
-
158
-
159
-
160
-
161
-
162
-
163
-
164
-
165
-
166
-
167
-
168
-
169
-
170
-
171
-
172
-
173
-
174
-
175
-
176
-
177
-
178
-
179
-
180
-
181
-
182
-
183
-
184
-
185
-
186
-
187
-
188
-
189
-
190
-
191
-
192
-
193
-
194
-
195
-
196
-
197
-
198
-
199
-
200
-
201
-
202
-
203
-
204
-
205
-
206
-
207
-
208
-
209
-
210
-
211
-
212
-
213
-
214
-
215
-
216
-
217
-
218
-
219
-
220
 |
 |

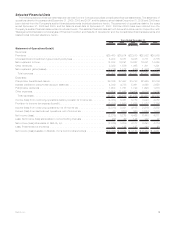
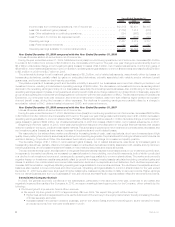
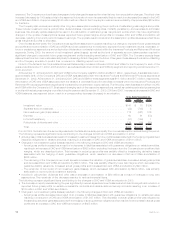
Selected Financial Data
The following selected financial data has been derived from the Company’s audited consolidated financial statements. The statement of
operations data for the years ended December 31, 2009, 2008 and 2007, and the balance sheet data at December 31, 2009 and 2008 have
been derived from the Company’s audited financial statements included elsewhere herein. The statement of operations data for the years
ended December 31, 2006 and 2005, and the balance sheet data at December 31, 2007, 2006 and 2005 have been derived from the
Company’s audited financial statements not included herein. The selected financial data set forth below should be read in conjunction with
“Management’s Discussion and Analysis of Financial Condition and Results of Operations” and the consolidated financial statements and
related notes included elsewhere herein.
2009 2008 2007 2006 2005
Years Ended December 31,
(In millions)
Statement of Operations Data(1)
Revenues:
Premiums ................................................ $26,460 $25,914 $22,970 $22,052 $20,979
Universal life and investment-type product policy fees . . . . . . . . . . . . . . . . . . . . 5,203 5,381 5,238 4,711 3,775
Netinvestmentincome........................................ 14,838 16,291 18,057 16,241 14,058
Otherrevenues............................................. 2,329 1,586 1,465 1,301 1,221
Netinvestmentgains(losses).................................... (7,772) 1,812 (578) (1,382) (112)
Totalrevenues ............................................ 41,058 50,984 47,152 42,923 39,921
Expenses:
Policyholderbenefitsandclaims.................................. 28,336 27,437 23,783 22,869 22,236
Interest credited to policyholder account balances . . . . . . . . . . . . . . . . . . . . . . 4,849 4,788 5,461 4,899 3,650
Policyholderdividends ........................................ 1,650 1,751 1,723 1,698 1,678
Otherexpenses............................................. 10,556 11,947 10,405 9,514 8,269
Totalexpenses............................................ 45,391 45,923 41,372 38,980 35,833
Income (loss) from continuing operations before provision for income tax . . . . . . . . (4,333) 5,061 5,780 3,943 4,088
Provisionforincometaxexpense(benefit)............................ (2,015) 1,580 1,675 1,027 1,156
Income (loss) from continuing operations, net of income tax . . . . . . . . . . . . . . . . (2,318) 3,481 4,105 2,916 2,932
Income (loss) from discontinued operations, net of income tax . . . . . . . . . . . . . . 40 (203) 360 3,524 1,879
Netincome(loss)............................................ (2,278) 3,278 4,465 6,440 4,811
Less: Net income (loss) attributable to noncontrolling interests . . . . . . . . . . . . . . (32) 69 148 147 97
Net income (loss) attributable to MetLife, Inc. . . . . . . . . . . . . . . . . . . . . . . . . . (2,246) 3,209 4,317 6,293 4,714
Less:Preferredstockdividends .................................. 122 125 137 134 63
Net income (loss) available to MetLife, Inc.’s common shareholders . . . . . . . . . . . $ (2,368) $ 3,084 $ 4,180 $ 6,159 $ 4,651
3MetLife, Inc.