MetLife 2009 Annual Report Download - page 30
Download and view the complete annual report
Please find page 30 of the 2009 MetLife annual report below. You can navigate through the pages in the report by either clicking on the pages listed below, or by using the keyword search tool below to find specific information within the annual report.-
 1
1 -
2
-
3
-
4
-
5
-
6
-
7
-
8
-
9
-
10
-
11
-
12
-
13
-
14
-
15
-
16
-
17
-
18
-
19
-
 20
20 -
 21
21 -
 22
22 -
 23
23 -
 24
24 -
 25
25 -
 26
26 -
 27
27 -
 28
28 -
 29
29 -
 30
30 -
 31
31 -
 32
32 -
 33
33 -
 34
34 -
 35
35 -
 36
36 -
 37
37 -
 38
38 -
 39
39 -
 40
40 -
41
-
42
-
43
-
44
-
45
-
46
-
47
-
48
-
49
-
50
-
51
-
52
-
53
-
54
-
55
-
56
-
57
-
58
-
59
-
60
-
61
-
62
-
63
-
64
-
65
-
66
-
67
-
68
-
69
-
70
-
71
-
72
-
73
-
74
-
75
-
76
-
77
-
78
-
79
-
80
-
81
-
82
-
83
-
84
-
85
-
86
-
87
-
88
-
89
-
90
-
91
-
92
-
93
-
94
-
95
-
96
-
97
-
98
-
99
-
100
-
101
-
102
-
103
-
104
-
105
-
106
-
107
-
108
-
109
-
110
-
111
-
112
-
113
-
114
-
115
-
116
-
117
-
118
-
119
-
120
-
121
-
122
-
123
-
124
-
125
-
126
-
127
-
128
-
129
-
130
-
131
-
132
-
133
-
134
-
135
-
136
-
137
-
138
-
139
-
140
-
141
-
142
-
143
-
144
-
145
-
146
-
147
-
148
-
149
-
150
-
151
-
152
-
153
-
154
-
155
-
156
-
157
-
158
-
159
-
160
-
161
-
162
-
163
-
164
-
165
-
166
-
167
-
168
-
169
-
170
-
171
-
172
-
173
-
174
-
175
-
176
-
177
-
178
-
179
-
180
-
181
-
182
-
183
-
184
-
185
-
186
-
187
-
188
-
189
-
190
-
191
-
192
-
193
-
194
-
195
-
196
-
197
-
198
-
199
-
200
-
201
-
202
-
203
-
204
-
205
-
206
-
207
-
208
-
209
-
210
-
211
-
212
-
213
-
214
-
215
-
216
-
217
-
218
-
219
-
220
 |
 |

expected policy assessments based on the level of guaranteed minimum benefits generated using multiple scenarios of separate account
returns. The scenarios use best estimate assumptions consistent with those used to amortize DAC. Because separate account balances
have had positive returns relative to the prior year, current estimates of future benefits are lower than that previously projected which resulted
in a decrease in this liability in the current period. Partially offsetting these increases, higher DAC amortization of $49 million resulted from
business growth and favorable investment results.
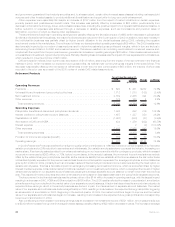
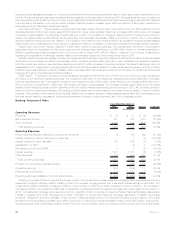
Latin America Region. The decrease in operating earnings was primarily driven by lower net investment income. Net investment income
decreased by $297 million due to a decrease of $383 million from lower yields, partially offset by an increase of $86 million due to an increase
in average invested assets. The decrease in yields was due, in part, to the impact of changes in assumptions for measuring the effects of
inflation on certain inflation-indexed fixed maturity securities. This decrease was partially offset by a reduction of $221 million in the related
insurance liability primarily due to lower inflation. The increase in net investment income attributable to an increase in average invested assets
was primarily due to business growth and, as such, was largely offset by increases in policyholder benefits and interest credited expense.
Higher claim experience in Mexico resulted in a $45 million decline in operating earnings. The nationalization and reform of the pension
business in Argentina impacted both the current year and prior year earnings, resulting in a net $36 million decline in operating earnings. In
addition, operating earnings decreased due to a net income tax increase of $8 million in Mexico, resulting from a change in assumption
regarding the repatriation of earnings, partially offset by the favorable impact of a lower effective tax rate in 2009.
Partially offsetting these decreases in operating earnings was the combination of growth in Mexico’s individual and institutional businesses
and higher premium rates in its institutional business, which increased operating earnings by $51 million. Pesification in Argentina impacted
both the current year and prior year earnings, resulting in a net $73 million increase in operating earnings. This benefit was largely due to a
reassessment of our approach in managing existing and potential future claims related to certain social security pension annuity contract
holders in Argentina resulting in a liability release. Lower expenses of $8 million resulted primarily from the impact of operational efficiencies
achieved through our Operational Excellence initiative.
EMEI Region. The impact of foreign currency transaction gains and a tax benefit, both of which occurred in the prior year, contributed
$12 million to the decline in operating earnings. Our investment of $9 million in our distribution capability and growth initiatives in 2009 also
reduced operating earnings. There was an increase in net investment income of $76 million, which was due to an increase of $65 million from
an improvement in yields and $11 million from an increase in average invested assets. The increase in yields was primarily due to favorable
results on the trading securities portfolio, stemming from the equity markets experiencing some recovery in 2009. As our trading portfolio
backs unit-linked policyholder liabilities, the trading portfolio results were entirely offset by a corresponding increase in interest credited
expense. The increase in net investment income attributable to an increase in average invested assets was primarily due to business growth
and was largely offset by increases in policyholder benefits and interest credited expense, also due to business growth.
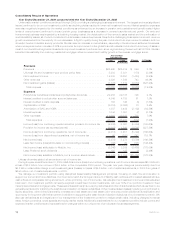
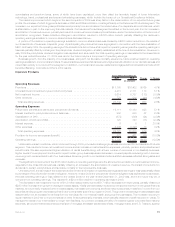
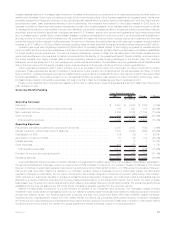
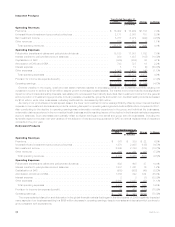
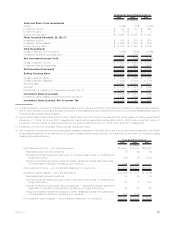
Banking, Corporate & Other
2009 2008 Change % Change
Years Ended December 31,
(In millions)
Operating Revenues
Premiums................................................... $ 19 $ 27 $ (8) (29.6)%
Netinvestmentincome .......................................... 477 808 (331) (41.0)%
Otherrevenues ............................................... 1,092 184 908 493.5%
Totaloperatingrevenues........................................ 1,588 1,019 569 55.8%
Operating Expenses
Policyholderbenefitsandclaimsandpolicyholderdividends .................. 4 46 (42) (91.3)%
Interestcreditedtopolicyholderaccountbalances ........................ — 7 (7) (100.0)%
Interestcreditedtobankdeposits ................................... 163 166 (3) (1.8)%
CapitalizationofDAC ........................................... — (3) 3 (100.0)%
AmortizationofDACandVOBA..................................... 3 5 (2) (40.0)%
Interestexpense .............................................. 1,027 1,033 (6) (0.6)%
Otherexpenses............................................... 1,336 699 637 91.1%
Totaloperatingexpenses ....................................... 2,533 1,953 580 29.7%
Provisionforincometaxexpense(benefit).............................. (617) (495) (122) (24.6)%
Operatingearnings............................................. (328) (439) 111 25.3%
Preferredstockdividends......................................... 122 125 (3) (2.4)%
Operatingearningsavailabletocommonshareholders...................... $ (450) $ (564) $114 20.2%
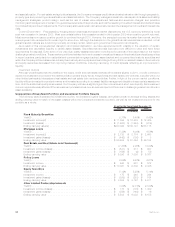
Banking, Corporate & Other recognized the full year impact of our forward and reverse residential mortgage platform acquisitions, a strong
residential mortgage refinance market, healthy growth in the reverse mortgage arena, and a favorable interest spread environment. Our
forward and reverse residential mortgage production of $37.4 billion in 2009 is up 484% compared to 2008 production. The increase in
mortgage production drove higher investments in residential mortgage loans held-for-sale and mortgage servicing rights. At December 31,
2009, our residential mortgage loans servicing portfolio was $64.1 billion comprised of agency (Federal National Mortgage Association
(“FNMA”), Federal Home Loan Mortgage Corporation (“FHLMC”) or Government National Mortgage Association (“GNMA”) securities)
portfolios. Transaction and time deposits, which provide a relatively stable source of funding and liquidity and are used to fund loans
and fixed income securities purchases, grew 48% in 2009 to $10.2 billion. Borrowings decreased 10% in 2009 to $2.4 billion. During 2009,
we participated in the Federal Reserve Bank of New York Term Auction Facility, which provided short term liquidity with low funding costs.
24 MetLife, Inc.