MetLife 2009 Annual Report Download - page 28
Download and view the complete annual report
Please find page 28 of the 2009 MetLife annual report below. You can navigate through the pages in the report by either clicking on the pages listed below, or by using the keyword search tool below to find specific information within the annual report.-
 1
1 -
2
-
3
-
4
-
5
-
6
-
7
-
8
-
9
-
10
-
11
-
12
-
13
-
14
-
15
-
16
-
17
-
 18
18 -
 19
19 -
 20
20 -
 21
21 -
 22
22 -
 23
23 -
 24
24 -
 25
25 -
 26
26 -
 27
27 -
 28
28 -
 29
29 -
 30
30 -
 31
31 -
 32
32 -
 33
33 -
 34
34 -
 35
35 -
 36
36 -
 37
37 -
 38
38 -
39
-
40
-
41
-
42
-
43
-
44
-
45
-
46
-
47
-
48
-
49
-
50
-
51
-
52
-
53
-
54
-
55
-
56
-
57
-
58
-
59
-
60
-
61
-
62
-
63
-
64
-
65
-
66
-
67
-
68
-
69
-
70
-
71
-
72
-
73
-
74
-
75
-
76
-
77
-
78
-
79
-
80
-
81
-
82
-
83
-
84
-
85
-
86
-
87
-
88
-
89
-
90
-
91
-
92
-
93
-
94
-
95
-
96
-
97
-
98
-
99
-
100
-
101
-
102
-
103
-
104
-
105
-
106
-
107
-
108
-
109
-
110
-
111
-
112
-
113
-
114
-
115
-
116
-
117
-
118
-
119
-
120
-
121
-
122
-
123
-
124
-
125
-
126
-
127
-
128
-
129
-
130
-
131
-
132
-
133
-
134
-
135
-
136
-
137
-
138
-
139
-
140
-
141
-
142
-
143
-
144
-
145
-
146
-
147
-
148
-
149
-
150
-
151
-
152
-
153
-
154
-
155
-
156
-
157
-
158
-
159
-
160
-
161
-
162
-
163
-
164
-
165
-
166
-
167
-
168
-
169
-
170
-
171
-
172
-
173
-
174
-
175
-
176
-
177
-
178
-
179
-
180
-
181
-
182
-
183
-
184
-
185
-
186
-
187
-
188
-
189
-
190
-
191
-
192
-
193
-
194
-
195
-
196
-
197
-
198
-
199
-
200
-
201
-
202
-
203
-
204
-
205
-
206
-
207
-
208
-
209
-
210
-
211
-
212
-
213
-
214
-
215
-
216
-
217
-
218
-
219
-
220
 |
 |

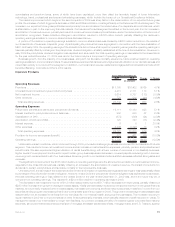
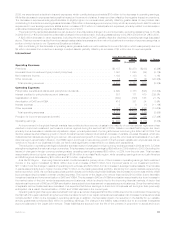
Policyholder account balances for our investment-type products were down by approximately $10 billion during 2009, as issuances were
more than offset by scheduled maturities. However, due to the timing of issuances and maturities, the average policyholder account balances
and liabilities increased from 2008 to 2009. The impact of the decrease in policyholder account balances resulted in lower net investment
income, which was somewhat offset by lower interest credited expense.
The primary driver of the $362 million decrease in operating earnings was lower net investment income of $720 million reflecting a
$732 million decrease from lower yields and a $12 million increase due to growth in average invested assets. Yields were adversely impacted
by the severe downturn in the global financial markets which impacted real estate joint ventures, fixed maturity securities, other invested
assets and mortgage loans. In addition, income from our securities lending program decreased, primarily due to the smaller size of the
program during the year. To manage the needs of our longer-term liabilities, our portfolio consists primarily of investment grade corporate fixed
maturity securities, mortgage loans, U.S. Treasury, agency and government guaranteed securities and, to a lesser extent, certain other
invested asset classes including real estate joint ventures in order to provide additional diversification and opportunity for long-term yield
enhancement. For our shorter-term obligations, we invest primarily in structured finance securities, mortgage loans and investment grade
corporate fixed maturity securities. The yields on these investments have moved consistent with the underlying market indices, primarily
LIBOR and Treasury, on which they are based. The growth in the average invested asset base is consistent with the increase in the average
policyholder account balances and liabilities.
As many of our products are interest spread-based, the lower net investment income was somewhat offset by lower net interest credited
expense of $382 million. The decrease in interest credited expense is attributed to $438 million from lower crediting rates. Crediting rates
have moved consistent with the underlying market indices, primarily LIBOR, on which they are based. The increase in the average policyholder
account balances resulted in a $56 million increase in interest credited expense.
The year over year decline in operating earnings was also due in part to lower other revenues as the prior year benefited by $44 million in
fees for the cancellation of a bank owned life insurance stable value wrap policy combined with the surrender of a global guaranteed interest
contract. In addition, a refinement to a reinsurance recoverable in the small business record keeping line of business in the latter part of 2009
also contributed $20 million to the decrease in operating earnings.
Current year results benefited from favorable liability refinements as compared to unfavorable liability refinements in 2008, as well as
improved mortality experience in the current year, all in the pension closeouts business. These items improved 2009 operating earnings by
approximately $90 million. Other products generated mortality gains or losses; however, the net change did not have a material impact on our
year over year results.
Although our other expenses only increased marginally and are not a significant driver of the decrease in operating earnings, the general
themes associated with the increase are consistent with those factors discussed above in the discussion of our consolidated results of
operations. Market conditions triggered an increase in our pension and postretirement benefit expenses of $27 million. In addition, variable
expenses, such as commissions and premium taxes, have increased $8 million. These increases were partially offset by a decrease of
$30 million, primarily in information technology, travel and professional services expenses, all of which were largely due to our Operational
Excellence initiative.
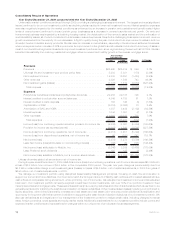
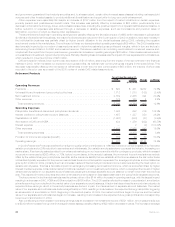
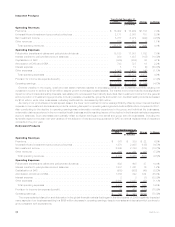
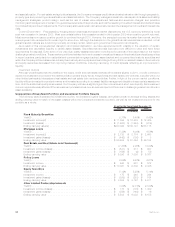
Auto & Home
2009 2008 Change % Change
Years Ended December 31,
(In millions)
Operating Revenues
Premiums .................................................... $2,902 $2,971 $(69) (2.3)%
Netinvestmentincome............................................ 180 186 (6) (3.2)%
Otherrevenues................................................. 33 38 (5) (13.2)%
Totaloperatingrevenues ......................................... 3,115 3,195 (80) (2.5)%
Operating Expenses
Policyholder benefits and claims and policyholder dividends . . . . . . . . . . . . . . . . . . . . 1,932 1,924 8 0.4%
CapitalizationofDAC............................................. (435) (444) 9 2.0%
AmortizationofDACandVOBA ...................................... 436 454 (18) (4.0)%
Otherexpenses ................................................ 764 794 (30) (3.8)%
Totaloperatingexpenses......................................... 2,697 2,728 (31) (1.1)%
Provisionforincometaxexpense(benefit) ............................... 96 104 (8) (7.7)%
Operatingearnings .............................................. $ 322 $ 363 $(41) (11.3)%
Auto & Home was negatively impacted in 2009 by a declining housing market, the deterioration of the new auto sales market and the
continuation of credit availability issues, all of which contributed to a decrease in insured exposures in 2009. Average premiums per policy
increased slightly for our homeowners’ policies but decreased for auto policies, primarily as a result of a business shift in insured exposures by
state. In particular, we experienced a large decrease in earned exposures in Massachusetts, whose market was impacted by a regulatory
change, which resulted in a marked increase in competition.
A return to more normal weather conditions in 2009 resulted in fewer, and less severe, catastrophe events than in 2008. This was more
than offset by an increase in both non-catastrophe claim frequencies and non-catastrophe claim severities in 2009.
Mixed claim experience and the impact of lower exposures were the primary drivers of the $41 million decrease in operating earnings.
While we had a $90 million decrease in catastrophe related losses compared to the prior year, we also recorded $68 million less of a benefit in
2009 from favorable development of prior year non-catastrophe losses. Current year claim costs rose primarily as a result of a $29 million
increase in claim frequency from both our auto and homeowners products. In addition, we had a $15 million net increase in claim severity,
stemming from higher severity in our auto line of business that was partially offset by lower severity in our homeowners line of business. In
22 MetLife, Inc.