MetLife 2009 Annual Report Download - page 43
Download and view the complete annual report
Please find page 43 of the 2009 MetLife annual report below. You can navigate through the pages in the report by either clicking on the pages listed below, or by using the keyword search tool below to find specific information within the annual report.-
 1
1 -
2
-
3
-
4
-
5
-
6
-
7
-
8
-
9
-
10
-
11
-
12
-
13
-
14
-
15
-
16
-
17
-
18
-
19
-
20
-
21
-
22
-
23
-
24
-
25
-
26
-
27
-
28
-
29
-
30
-
31
-
32
-
 33
33 -
 34
34 -
 35
35 -
 36
36 -
 37
37 -
 38
38 -
 39
39 -
 40
40 -
 41
41 -
 42
42 -
 43
43 -
 44
44 -
 45
45 -
 46
46 -
 47
47 -
 48
48 -
 49
49 -
 50
50 -
 51
51 -
 52
52 -
 53
53 -
54
-
55
-
56
-
57
-
58
-
59
-
60
-
61
-
62
-
63
-
64
-
65
-
66
-
67
-
68
-
69
-
70
-
71
-
72
-
73
-
74
-
75
-
76
-
77
-
78
-
79
-
80
-
81
-
82
-
83
-
84
-
85
-
86
-
87
-
88
-
89
-
90
-
91
-
92
-
93
-
94
-
95
-
96
-
97
-
98
-
99
-
100
-
101
-
102
-
103
-
104
-
105
-
106
-
107
-
108
-
109
-
110
-
111
-
112
-
113
-
114
-
115
-
116
-
117
-
118
-
119
-
120
-
121
-
122
-
123
-
124
-
125
-
126
-
127
-
128
-
129
-
130
-
131
-
132
-
133
-
134
-
135
-
136
-
137
-
138
-
139
-
140
-
141
-
142
-
143
-
144
-
145
-
146
-
147
-
148
-
149
-
150
-
151
-
152
-
153
-
154
-
155
-
156
-
157
-
158
-
159
-
160
-
161
-
162
-
163
-
164
-
165
-
166
-
167
-
168
-
169
-
170
-
171
-
172
-
173
-
174
-
175
-
176
-
177
-
178
-
179
-
180
-
181
-
182
-
183
-
184
-
185
-
186
-
187
-
188
-
189
-
190
-
191
-
192
-
193
-
194
-
195
-
196
-
197
-
198
-
199
-
200
-
201
-
202
-
203
-
204
-
205
-
206
-
207
-
208
-
209
-
210
-
211
-
212
-
213
-
214
-
215
-
216
-
217
-
218
-
219
-
220
 |
 |

• Net transfers in and/or out of Level 3 for fixed maturity securities were ($1,543) million for the year ended December 31, 2009, and was
comprised of transfers in of $3,490 million and transfers out of ($5,033) million, respectively.
Overall, transfers in and/or out of Level 3 are attributable to a change in the observability of inputs. During the year ended December 31,
2009, fixed maturity securities transfers out of Level 3 of $5,033 million resulted primarily from increased transparency of both new issuances
that subsequent to issuance and establishment of trading activity, became priced by pricing services and existing issuances that, over time,
the Company was able to corroborate pricing received from independent pricing services with observable inputs, primarily for U.S. and
foreign corporate securities. During the year ended December 31, 2009, fixed maturity securities transfers into Level 3 of $3,490 million
resulted primarily from current market conditions characterized by a lack of trading activity, decreased liquidity, fixed maturity securities going
into default and credit ratings downgrades (e.g., from investment grade to below investment grade). These current market conditions have
resulted in decreased transparency of valuations and an increased use of broker quotations and unobservable inputs to determine estimated
fair value principally for U.S. and foreign corporate securities.
See “— Summary of Critical Accounting Estimates — Estimated Fair Value of Investments” for further information on the estimates and
assumptions that affect the amounts reported above.
Fixed Maturity Securities Credit Quality — Ratings. The Securities Valuation Office of the National Association of Insurance Commis-
sioners (“NAIC”) evaluates the fixed maturity security investments of insurers for regulatory reporting and capital assessment purposes and
assigns securities to one of six credit quality categories called “NAIC designations.” The NAIC ratings are generally similar to the rating agency
designations of the NRSRO for marketable fixed maturity securities. NAIC ratings 1 and 2 include fixed maturity securities generally
considered investment grade (i.e. rated “Baa3” or better by Moody’s or rated “BBB” or better by S&P and Fitch), by such rating organizations.
NAIC ratings 3 through 6 include fixed maturity securities generally considered below investment grade (i.e. rated “Ba1” or lower by Moody’s,
orrated“BB+”orlowerbyS&PandFitch),bysuchratingorganizations.
The NAIC adopted a revised rating methodology for non-agency RMBS that became effective December 31, 2009. The NAIC’s objective
with the revised rating methodology for non-agency RMBS was to increase the accuracy in assessing expected losses, and to use the
improved assessment to determine a more appropriate capital requirement for non-agency RMBS. The revised methodology reduces
regulatory reliance on rating agencies and allows for greater regulatory input into the assumptions used to estimate expected losses from
non-agency RMBS.
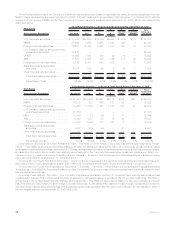
The following three tables present information about the Company’s fixed maturity securities holdings by credit quality ratings. Amounts
presented for non-agency RMBS, including RMBS backed by sub-prime mortgage loans reported within ABS, held by the Company’s
domestic insurance subsidiaries at December 31, 2009 are based on final ratings from the revised NAIC rating methodology which became
effective December 31, 2009. Comparisons between NAIC ratings and rating agency designations are published by the NAIC. The rating
agency designations were based on availability of applicable ratings from those rating agencies on the NAIC acceptable rating organizations
list. If no rating is available from a rating agency, then an internally developed rating is used.
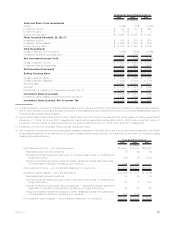
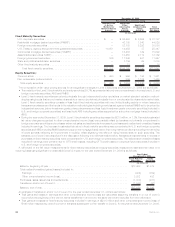
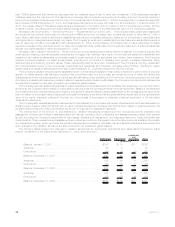
The following table presents the Company’s total fixed maturity securities by NRSRO designation and the equivalent ratings of the NAIC, as
well as the percentage, based on estimated fair value, that each designation is comprised of at December 31, 2009 and 2008, with the
exception of non-agency RMBS held by the Company’s domestic insurance subsidiaries at December 31, 2009, which are presented as
described above:
NAIC
Rating Rating Agency Designation
Cost or
Amortized
Cost
Estimated
Fair
Value %of
Total
Cost or
Amortized
Cost
Estimated
Fair
Value %of
Total
2009 2008
December 31,
(In millions)
1 Aaa/Aa/A . . . . . . . . . . . . . . . . . . . . . . $151,391 $151,136 66.4% $146,796 $137,125 72.9%
2 Baa . . . . . . . . . . . . . . . . . . . . . . . . . . 55,508 56,305 24.7 45,253 38,761 20.6
3 Ba . . . . . . . . . . . . . . . . . . . . . . . . . . . 13,184 12,003 5.3 10,258 7,796 4.1
4 B ........................... 7,474 6,461 2.9 5,915 3,779 2.0
5 Caa and lower . . . . . . . . . . . . . . . . . . . 1,809 1,425 0.6 1,192 715 0.4
6 Inorneardefault ................. 343 312 0.1 94 75 —
Total fixed maturity securities . . . . . . . . . $229,709 $227,642 100.0% $209,508 $188,251 100.0%
37MetLife, Inc.