MetLife 2009 Annual Report Download - page 50
Download and view the complete annual report
Please find page 50 of the 2009 MetLife annual report below. You can navigate through the pages in the report by either clicking on the pages listed below, or by using the keyword search tool below to find specific information within the annual report.-
 1
1 -
2
-
3
-
4
-
5
-
6
-
7
-
8
-
9
-
10
-
11
-
12
-
13
-
14
-
15
-
16
-
17
-
18
-
19
-
20
-
21
-
22
-
23
-
24
-
25
-
26
-
27
-
28
-
29
-
30
-
31
-
32
-
33
-
34
-
35
-
36
-
37
-
38
-
39
-
 40
40 -
 41
41 -
 42
42 -
 43
43 -
 44
44 -
 45
45 -
 46
46 -
 47
47 -
 48
48 -
 49
49 -
 50
50 -
 51
51 -
 52
52 -
 53
53 -
 54
54 -
 55
55 -
 56
56 -
 57
57 -
 58
58 -
 59
59 -
 60
60 -
61
-
62
-
63
-
64
-
65
-
66
-
67
-
68
-
69
-
70
-
71
-
72
-
73
-
74
-
75
-
76
-
77
-
78
-
79
-
80
-
81
-
82
-
83
-
84
-
85
-
86
-
87
-
88
-
89
-
90
-
91
-
92
-
93
-
94
-
95
-
96
-
97
-
98
-
99
-
100
-
101
-
102
-
103
-
104
-
105
-
106
-
107
-
108
-
109
-
110
-
111
-
112
-
113
-
114
-
115
-
116
-
117
-
118
-
119
-
120
-
121
-
122
-
123
-
124
-
125
-
126
-
127
-
128
-
129
-
130
-
131
-
132
-
133
-
134
-
135
-
136
-
137
-
138
-
139
-
140
-
141
-
142
-
143
-
144
-
145
-
146
-
147
-
148
-
149
-
150
-
151
-
152
-
153
-
154
-
155
-
156
-
157
-
158
-
159
-
160
-
161
-
162
-
163
-
164
-
165
-
166
-
167
-
168
-
169
-
170
-
171
-
172
-
173
-
174
-
175
-
176
-
177
-
178
-
179
-
180
-
181
-
182
-
183
-
184
-
185
-
186
-
187
-
188
-
189
-
190
-
191
-
192
-
193
-
194
-
195
-
196
-
197
-
198
-
199
-
200
-
201
-
202
-
203
-
204
-
205
-
206
-
207
-
208
-
209
-
210
-
211
-
212
-
213
-
214
-
215
-
216
-
217
-
218
-
219
-
220
 |
 |

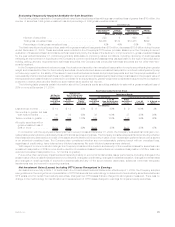
of OTTI loss recognized in earnings on fixed maturity securities still held by the Company at December 31, 2009 for which a portion of the OTTI
loss was recognized in other comprehensive loss for the year ended December 31, 2009.
Securities Lending
The Company participates in a securities lending program whereby blocks of securities, which are included in fixed maturity securities and
short-term investments, are loaned to third parties, primarily brokerage firms and commercial banks. The Company generally obtains
collateral in an amount equal to 102% of the estimated fair value of the loaned securities, which is obtained at the inception of a loan and
maintained at a level greater than or equal to 100% for the duration of the loan. In limited instances, during the extraordinary market events
beginning in the fourth quarter of 2008 and through part of 2009, we accepted collateral less than 102% at the inception of certain loans, but
never less than 100%, of the estimated fair value of such loaned securities. These loans involved U.S. Government Treasury Bills which are
considered to have limited variation in their estimated fair value during the term of the loan. Securities loaned under such transactions may be
sold or repledged by the transferee. The Company is liable to return to its counterparties the cash collateral under its control.
Elements of the securities lending program is presented in Note 3 of the Notes to the Consolidated Financial Statements under “—
Investments — Securities Lending.”
The estimated fair value of the securities related to the cash collateral on open at December 31, 2009 has been reduced to $3,193 million
from $4,986 million at December 31, 2008. Of the $3,193 million of estimated fair value of the securities related to the cash collateral on open
at December 31, 2009, $3,012 million were U.S. Treasury, agency and government guaranteed securities which, if put to the Company, can
be immediately sold to satisfy the cash requirements. The remainder of the securities on loan, related to the cash collateral aged less than
thirty days to ninety days or greater, was primarily U.S. Treasury, agency, and government guaranteed securities, and very liquid RMBS. The
U.S. Treasury securities on loan are primarily holdings of on-the-run U.S. Treasury securities, the most liquid U.S. Treasury securities
available. If these high quality securities that are on loan are put back to the Company, the proceeds from immediately selling these securities
can be used to satisfy the related cash requirements. The reinvestment portfolio acquired with the cash collateral consisted principally of fixed
maturity securities (including RMBS, ABS, U.S. corporate and foreign corporate securities). If the on loan securities or the reinvestment
portfolio become less liquid, the Company has the liquidity resources of most of its general account available to meet any potential cash
demands when securities are put back to the Company.
Security collateral on deposit from counterparties in connection with the securities lending transactions may not be sold or repledged,
unless the counterparty is in default, and is not reflected in the consolidated financial statements.
Invested Assets on Deposit, Held in Trust and Pledged as Collateral
The invested assets on deposit, invested assets held in trust and invested assets pledged as collateral at December 31, 2009 and 2008
are presented in a table in Note 3 of the Notes to the Consolidated Financial Statements “— Investments — Invested Assets on Deposit, Held
in Trust and Pledged as Collateral.”
See also “— Investments — Securities Lending” for the amount of the Company’s cash and invested assets received from and due back
to counterparties pursuant to the securities lending program.
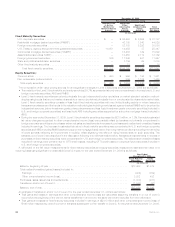
Trading Securities
The Company has trading securities to support investment strategies that involve the active and frequent purchase and sale of securities,
the execution of short sale agreements and asset and liability matching strategies for certain insurance products. Trading securities which
consisted principally of publicly-traded fixed maturity and equity securities, were $2.4 billion and $0.9 billion, or 0.7% and 0.3% of total cash
and invested assets at estimated fair value, at December 31, 2009 and 2008, respectively. See Note 3 of the Notes to the Consolidated
Financial Statements “Investments— Trading Securities” for tables which present information about the trading securities, related short sale
agreement liabilities, investments pledged to secure short sale agreement liabilities, net investment income and changes in estimated fair
value included in net investment income at December 31, 2009 and 2008 and for the years ended December 31, 2009, 2008 and 2007.
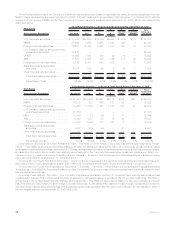
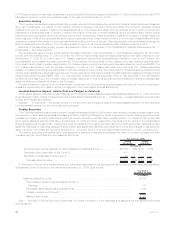
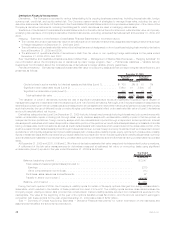
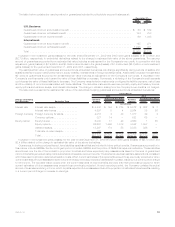
The trading securities and trading (short sale agreement) liabilities, measured at estimated fair value on a recurring basis and their
corresponding fair value hierarchy, are presented as follows:
Trading
Securities Trading
Liabilities
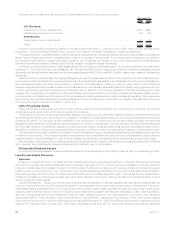
December 31, 2009
(In millions)
Quoted prices in active markets for identical assets and liabilities (Level 1) . . . . . . . . . . $1,886 79% $106 100%
Significantotherobservableinputs(Level2).............................. 415 17 — —
Significantunobservableinputs(Level3)................................ 83 4 — —
Totalestimatedfairvalue......................................... $2,384 100% $106 100%
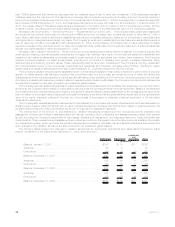
A rollforward of the fair value measurements for trading securities measured at estimated fair value on a recurring basis using significant
unobservable (Level 3) inputs for the year ended December 31, 2009, is as follows:
Year Ended
December 31, 2009
(In millions)
Balance,beginningofyear ................................................. $175
Total realized/unrealized gains (losses) included in:
Earnings .......................................................... 16
Purchases,sales,issuancesandsettlements.................................... (108)
Transferinand/oroutofLevel3 ............................................ —
Balance,endofyear.................................................... $ 83
See “— Summary of Critical Accounting Estimates” for further information on the estimates and assumptions that affect the amounts
reported above.
44 MetLife, Inc.