MetLife 2009 Annual Report Download - page 47
Download and view the complete annual report
Please find page 47 of the 2009 MetLife annual report below. You can navigate through the pages in the report by either clicking on the pages listed below, or by using the keyword search tool below to find specific information within the annual report.-
 1
1 -
2
-
3
-
4
-
5
-
6
-
7
-
8
-
9
-
10
-
11
-
12
-
13
-
14
-
15
-
16
-
17
-
18
-
19
-
20
-
21
-
22
-
23
-
24
-
25
-
26
-
27
-
28
-
29
-
30
-
31
-
32
-
33
-
34
-
35
-
36
-
 37
37 -
 38
38 -
 39
39 -
 40
40 -
 41
41 -
 42
42 -
 43
43 -
 44
44 -
 45
45 -
 46
46 -
 47
47 -
 48
48 -
 49
49 -
 50
50 -
 51
51 -
 52
52 -
 53
53 -
 54
54 -
 55
55 -
 56
56 -
 57
57 -
58
-
59
-
60
-
61
-
62
-
63
-
64
-
65
-
66
-
67
-
68
-
69
-
70
-
71
-
72
-
73
-
74
-
75
-
76
-
77
-
78
-
79
-
80
-
81
-
82
-
83
-
84
-
85
-
86
-
87
-
88
-
89
-
90
-
91
-
92
-
93
-
94
-
95
-
96
-
97
-
98
-
99
-
100
-
101
-
102
-
103
-
104
-
105
-
106
-
107
-
108
-
109
-
110
-
111
-
112
-
113
-
114
-
115
-
116
-
117
-
118
-
119
-
120
-
121
-
122
-
123
-
124
-
125
-
126
-
127
-
128
-
129
-
130
-
131
-
132
-
133
-
134
-
135
-
136
-
137
-
138
-
139
-
140
-
141
-
142
-
143
-
144
-
145
-
146
-
147
-
148
-
149
-
150
-
151
-
152
-
153
-
154
-
155
-
156
-
157
-
158
-
159
-
160
-
161
-
162
-
163
-
164
-
165
-
166
-
167
-
168
-
169
-
170
-
171
-
172
-
173
-
174
-
175
-
176
-
177
-
178
-
179
-
180
-
181
-
182
-
183
-
184
-
185
-
186
-
187
-
188
-
189
-
190
-
191
-
192
-
193
-
194
-
195
-
196
-
197
-
198
-
199
-
200
-
201
-
202
-
203
-
204
-
205
-
206
-
207
-
208
-
209
-
210
-
211
-
212
-
213
-
214
-
215
-
216
-
217
-
218
-
219
-
220
 |
 |

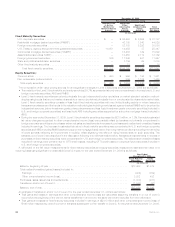
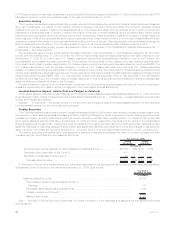
Evaluating Temporarily Impaired Available-for-Sale Securities
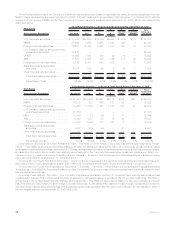
The following table presents the Company’s fixed maturity and equity securities with a gross unrealized loss of greater than $10 million, the
number of securities, total gross unrealized loss and percentage of total gross unrealized loss at:
Fixed Maturity
Securities Equity
Securities Fixed Maturity
Securities Equity
Securities
2009 2008
December 31,
(In millions, except number of securities)
Numberofsecurities.............................. 223 9 699 33
Totalgrossunrealizedloss .......................... $4,465 $132 $14,485 $699
Percentageoftotalgrossunrealizedloss................. 43% 48% 50% 71%
The fixed maturity and equity securities, each with a gross unrealized loss greater than $10 million, decreased $10.6 billion during the year
ended December 31, 2009. These securities were included in the Company’s OTTI review process. Based upon the Company’s current
evaluation of these securities in accordance with its impairment policy, the cause of the decline in, or improvement in, gross unrealized losses
for the year ended December 31, 2009 being primarily attributable to improving market conditions, including narrowing of credit spreads
reflecting an improvement in liquidity and the Company’s current intentions and assessments (as applicable to the type of security) about
holding, selling, and any requirements to sell these securities, the Company has concluded that these securities are not other-than-tem-
porarily impaired.
In the Company’s impairment review process, the duration and severity of an unrealized loss position for equity securities is given greater
weight and consideration than for fixed maturity securities. An extended and severe unrealized loss position on a fixed maturity security may
not have any impact on the ability of the issuer to service all scheduled interest and principal payments and the Company’s evaluation of
recoverability of all contractual cash flows or the ability to recover an amount at least equal to its amortized cost based on the present value of
the expected future cash flows to be collected. In contrast, for an equity security, greater weight and consideration is given by the Company to
a decline in market value and the likelihood such market value decline will recover.
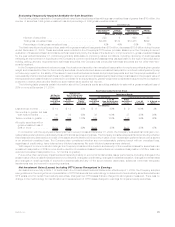
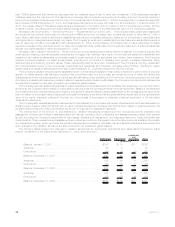
The following table presents certain information about the Company’s equity securities available-for-sale with a gross unrealized loss of
20% or more at December 31, 2009:
Gross
Unrealized
Loss
Gross
Unrealized
Loss
%ofAll
Equity
Securities
Gross
Unrealized
Loss
%ofAll
Non-Redeemable
Preferred Stock
Gross
Unrealized
Loss %ofAll
Industries %ARatedor
Better
All Equity
Securities
All Types of
Non-Redeemable
Preferred Stock All Industries Financial Services Industry
Investment Grade
Non-Redeemable Preferred Stock
(In millions)
Less than six months . . . . . . $ 14 $ 13 93% $ 9 69% $ 9 100% 3%
Six months or greater but less
than twelve months . . . . . . 40 39 98% 39 100% 37 95% 99%
Twelve months or greater . . . . 138 138 100% 138 100% 136 99% 62%
All equity securities with a
gross unrealized loss of
20% or more . . . . . . . . . . $192 $190 99% $186 98% $182 98% 67%
In connection with the equity securities impairment review process at December 31, 2009, the Company evaluated its holdings in non-
redeemable preferred stock, particularly those of financial services companies. The Company considered several factors including whether
there has been any deterioration in credit of the issuer and the likelihood of recovery in value of non-redeemable preferred stock with a severe
or an extended unrealized loss. The Company also considered whether any non-redeemable preferred stock with an unrealized loss,
regardless of credit rating, have deferred any dividend payments. No such dividend payments were deferred.
With respect to common stock holdings, the Company considered the duration and severity of the unrealized losses for securities in an
unrealized loss position of 20% or more and the duration of unrealized losses for securities in an unrealized loss position of 20% or less in an
extended unrealized loss position (i.e., 12 months or greater).
Future other-than-temporary impairments will depend primarily on economic fundamentals, issuer performance (including changes in the
present value of future cash flows expected to be collected), changes in credit rating, changes in collateral valuation, changes in interest rates
and changes in credit spreads. If economic fundamentals and any of the above factors deteriorate, additional other-than-temporary
impairments may be incurred in upcoming quarters.
Net Investment Gains (Losses) Including OTTI Losses Recognized in Earnings
As described more fully in Note 1 of the Notes to the Consolidated Financial Statements, effective April 1, 2009, the Company adopted
new guidance on the recognition and presentation of OTTI that amends the methodology to determine for fixed maturity securities whether an
OTTI exists, and for certain fixed maturity securities, changes how OTTI losses that are charged to earnings are measured. There was no
change in the methodology for identification and measurement of OTTI losses charged to earnings for impaired equity securities.
41MetLife, Inc.