MetLife 2009 Annual Report Download - page 34
Download and view the complete annual report
Please find page 34 of the 2009 MetLife annual report below. You can navigate through the pages in the report by either clicking on the pages listed below, or by using the keyword search tool below to find specific information within the annual report.-
 1
1 -
2
-
3
-
4
-
5
-
6
-
7
-
8
-
9
-
10
-
11
-
12
-
13
-
14
-
15
-
16
-
17
-
18
-
19
-
20
-
21
-
22
-
23
-
 24
24 -
 25
25 -
 26
26 -
 27
27 -
 28
28 -
 29
29 -
 30
30 -
 31
31 -
 32
32 -
 33
33 -
 34
34 -
 35
35 -
 36
36 -
 37
37 -
 38
38 -
 39
39 -
 40
40 -
 41
41 -
 42
42 -
 43
43 -
 44
44 -
45
-
46
-
47
-
48
-
49
-
50
-
51
-
52
-
53
-
54
-
55
-
56
-
57
-
58
-
59
-
60
-
61
-
62
-
63
-
64
-
65
-
66
-
67
-
68
-
69
-
70
-
71
-
72
-
73
-
74
-
75
-
76
-
77
-
78
-
79
-
80
-
81
-
82
-
83
-
84
-
85
-
86
-
87
-
88
-
89
-
90
-
91
-
92
-
93
-
94
-
95
-
96
-
97
-
98
-
99
-
100
-
101
-
102
-
103
-
104
-
105
-
106
-
107
-
108
-
109
-
110
-
111
-
112
-
113
-
114
-
115
-
116
-
117
-
118
-
119
-
120
-
121
-
122
-
123
-
124
-
125
-
126
-
127
-
128
-
129
-
130
-
131
-
132
-
133
-
134
-
135
-
136
-
137
-
138
-
139
-
140
-
141
-
142
-
143
-
144
-
145
-
146
-
147
-
148
-
149
-
150
-
151
-
152
-
153
-
154
-
155
-
156
-
157
-
158
-
159
-
160
-
161
-
162
-
163
-
164
-
165
-
166
-
167
-
168
-
169
-
170
-
171
-
172
-
173
-
174
-
175
-
176
-
177
-
178
-
179
-
180
-
181
-
182
-
183
-
184
-
185
-
186
-
187
-
188
-
189
-
190
-
191
-
192
-
193
-
194
-
195
-
196
-
197
-
198
-
199
-
200
-
201
-
202
-
203
-
204
-
205
-
206
-
207
-
208
-
209
-
210
-
211
-
212
-
213
-
214
-
215
-
216
-
217
-
218
-
219
-
220
 |
 |

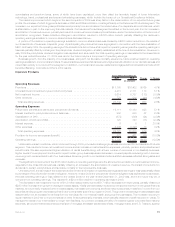
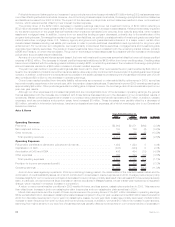
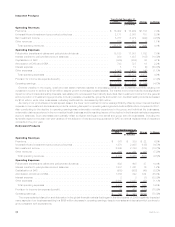
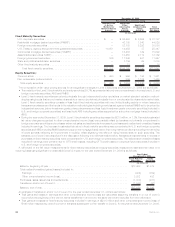
Insurance Products
2008 2007 Change % Change
Years Ended December 31,
(In millions)
Operating Revenues
Premiums................................................... $ 16,402 $ 15,269 $1,133 7.4%
Universallifeandinvestment-typeproductpolicyfees ...................... 2,171 2,061 110 5.3%
Netinvestmentincome .......................................... 5,787 6,079 (292) (4.8)%
Otherrevenues............................................... 819 810 9 1.1%
Totaloperatingrevenues........................................ 25,179 24,219 960 4.0%
Operating Expenses
Policyholder benefits and claims and policyholder dividends . . . . . . . . . . . . . . . . . . 18,183 17,001 1,182 7.0%
Interestcreditedtopolicyholderaccountbalances ........................ 930 1,037 (107) (10.3)%
CapitalizationofDAC ........................................... (849) (885) 36 4.1%
AmortizationofDACandVOBA..................................... 743 727 16 2.2%
Interestexpense .............................................. 5 10 (5) (50.0)%
Otherexpenses............................................... 4,196 4,241 (45) (1.1)%
Totaloperatingexpenses ....................................... 23,208 22,131 1,077 4.9%
Provisionforincometaxexpense(benefit).............................. 661 714 (53) (7.4)%
Operatingearnings............................................. $ 1,310 $ 1,374 $ (64) (4.7)%
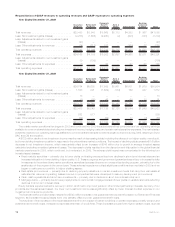
Extreme volatility in the equity, credit and real estate markets resulted in decreasing yields on our investment portfolio causing net
investment income to decline by $190 million despite growth in average invested assets. The market environment had its most significant
impact on other limited partnership interests, real estate joint ventures and fixed maturity securities. Net investment income from the general
account portion of investment-type products, including variable universal life, group life and certain non-medical health products decreased
by $135 million, while other businesses, including traditional life, decreased by $55 million.
As many of our products are interest spread-based, the lower net investment income was significantly offset by lower interest credited
expense on our investment and insurance products, reducing its impact on operating earnings which declined $64 million compared to 2007.
Also contributing to the decline in operating earnings was unfavorable mortality experience in the group and individual life businesses,
unfavorable claims experience in the non-medical health business and the resulting impact of the decline in the financial markets on separate
account balances. Such decreases were partially offset by higher earnings in the dental and group term life businesses, including the
favorable impact on the year over year variance of the adoption of new accounting guidance for DAC on internal replacements of insurance
contracts in the prior year.
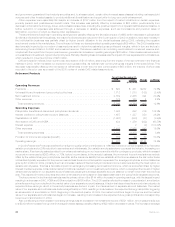
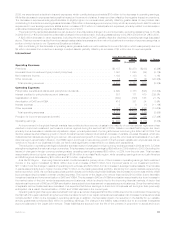
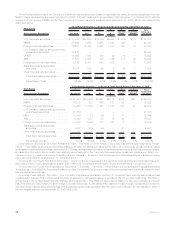
Retirement Products
2008 2007 Change % Change
Years Ended December 31,
(In millions)
Operating Revenues
Premiums.................................................... $ 361 $ 339 $ 22 6.5%
Universallifeandinvestment-typeproductpolicyfees ....................... 1,870 2,005 (135) (6.7)%
Netinvestmentincome ........................................... 2,365 2,740 (375) (13.7)%
Otherrevenues ................................................ 168 181 (13) (7.2)%
Totaloperatingrevenues......................................... 4,764 5,265 (501) (9.5)%
Operating Expenses
Policyholder benefits and claims and policyholder dividends . . . . . . . . . . . . . . . . . . . 692 605 87 14.4%
Interestcreditedtopolicyholderaccountbalances ......................... 1,337 1,321 16 1.2%
CapitalizationofDAC ............................................ (980) (932) (48) (5.2)%
AmortizationofDACandVOBA...................................... 1,356 822 534 65.0%
Interestexpense ............................................... 2 3 (1) (33.3)%
Otherexpenses................................................ 2,065 2,088 (23) (1.1)%
Totaloperatingexpenses ........................................ 4,472 3,907 565 14.5%
Provisionforincometaxexpense(benefit)............................... 99 469 (370) (78.9)%
Operating earnings . . . . . . . . . . . . . . . . . . . . . . . . . . . . . . . . . . . . . . . . . . . . . . $ 193 $ 889 $(696) (78.3)%
The unprecedented disruption and dislocation in the global financial markets that began in the third quarter of 2008 negatively impacted
many aspects of our business resulting in a $696 million decrease in operating earnings, despite new sales and deposits which continue to
grow consistent with expectations.
28 MetLife, Inc.