MetLife 2009 Annual Report Download - page 143
Download and view the complete annual report
Please find page 143 of the 2009 MetLife annual report below. You can navigate through the pages in the report by either clicking on the pages listed below, or by using the keyword search tool below to find specific information within the annual report.-
 1
1 -
2
-
3
-
4
-
5
-
6
-
7
-
8
-
9
-
10
-
11
-
12
-
13
-
14
-
15
-
16
-
17
-
18
-
19
-
20
-
21
-
22
-
23
-
24
-
25
-
26
-
27
-
28
-
29
-
30
-
31
-
32
-
33
-
34
-
35
-
36
-
37
-
38
-
39
-
40
-
41
-
42
-
43
-
44
-
45
-
46
-
47
-
48
-
49
-
50
-
51
-
52
-
53
-
54
-
55
-
56
-
57
-
58
-
59
-
60
-
61
-
62
-
63
-
64
-
65
-
66
-
67
-
68
-
69
-
70
-
71
-
72
-
73
-
74
-
75
-
76
-
77
-
78
-
79
-
80
-
81
-
82
-
83
-
84
-
85
-
86
-
87
-
88
-
89
-
90
-
91
-
92
-
93
-
94
-
95
-
96
-
97
-
98
-
99
-
100
-
101
-
102
-
103
-
104
-
105
-
106
-
107
-
108
-
109
-
110
-
111
-
112
-
113
-
114
-
115
-
116
-
117
-
118
-
119
-
120
-
121
-
122
-
123
-
124
-
125
-
126
-
127
-
128
-
129
-
130
-
131
-
132
-
 133
133 -
 134
134 -
 135
135 -
 136
136 -
 137
137 -
 138
138 -
 139
139 -
 140
140 -
 141
141 -
 142
142 -
 143
143 -
 144
144 -
 145
145 -
 146
146 -
 147
147 -
 148
148 -
 149
149 -
 150
150 -
 151
151 -
 152
152 -
 153
153 -
154
-
155
-
156
-
157
-
158
-
159
-
160
-
161
-
162
-
163
-
164
-
165
-
166
-
167
-
168
-
169
-
170
-
171
-
172
-
173
-
174
-
175
-
176
-
177
-
178
-
179
-
180
-
181
-
182
-
183
-
184
-
185
-
186
-
187
-
188
-
189
-
190
-
191
-
192
-
193
-
194
-
195
-
196
-
197
-
198
-
199
-
200
-
201
-
202
-
203
-
204
-
205
-
206
-
207
-
208
-
209
-
210
-
211
-
212
-
213
-
214
-
215
-
216
-
217
-
218
-
219
-
220
 |
 |
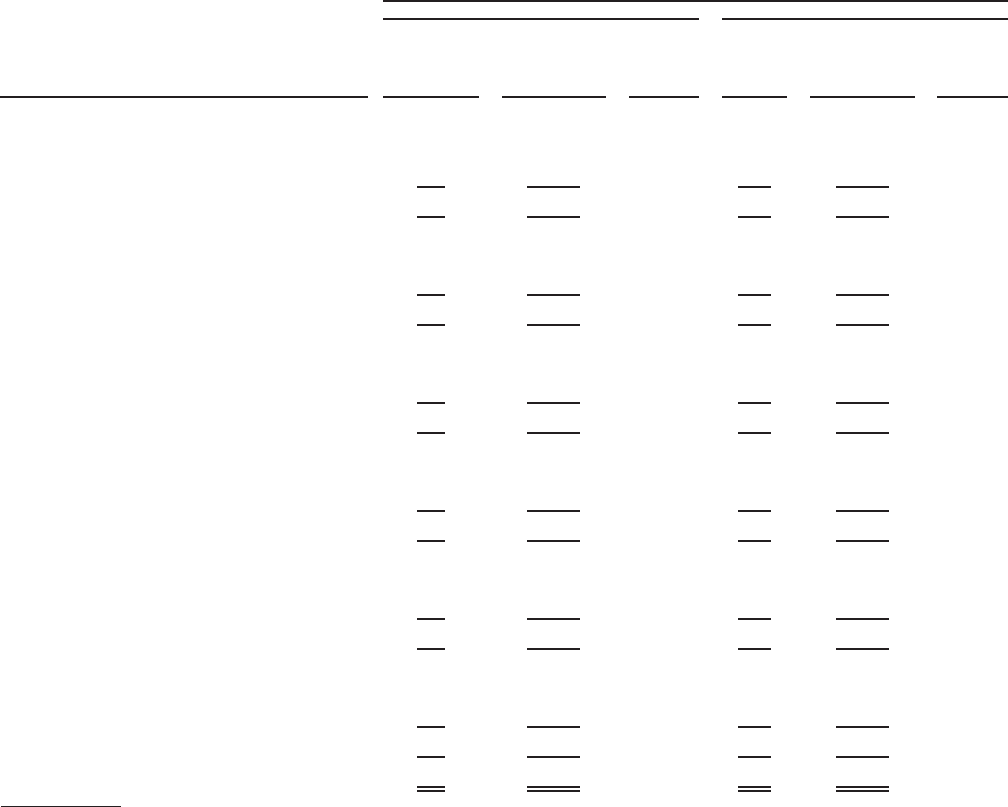
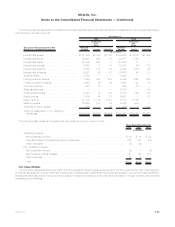
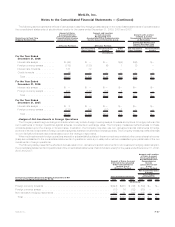
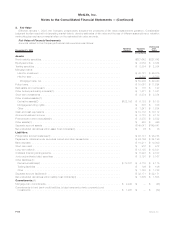
Credit Derivatives
In connection with synthetically created investment transactions and credit default swaps held in relation to the trading portfolio, the
Company writes credit default swaps for which it receives a premium to insure credit risk. Such credit derivatives are included within the non-
qualifying derivatives and derivatives for purposes other than hedging table. If a credit event, as defined by the contract, occurs generally the
contract will require the Company to pay the counterparty the specified swap notional amount in exchange for the delivery of par quantities of
the referenced credit obligation. The Company’s maximum amount at risk, assuming the value of all referenced credit obligations is zero, was
$3,101 million and $1,875 million at December 31, 2009 and 2008, respectively. The Company can terminate these contracts at any time
through cash settlement with the counterparty at an amount equal to the then current fair value of the credit default swaps. At December 31,
2009, the Company would have received $53 million to terminate all of these contracts, and at December 31, 2008, the Company would have
paid $37 million to terminate all of these contracts.
The Company has also entered into credit default swaps to purchase credit protection on certain of the referenced credit obligations in the
table below. As a result, the maximum amounts of potential future recoveries available to offset the $3,101 million and $1,875 million from the
table below were $31 million and $13 million at December 31, 2009 and 2008, respectively. The following table presents the estimated fair
value, maximum amount of future payments and weighted average years to maturity of written credit default swaps at December 31, 2009 and
2008:
Rating Agency Designation of Referenced
Credit Obligations (1)
Estimated
Fair
Value of Credit
Default
Swaps
Maximum
Amount
of Future
Payments under
Credit Default
Swaps(2)
Weighted
Average
Years to
Maturity(3)
Estimated
Fair Value
of Credit
Default
Swaps
Maximum
Amount of
Future
Payments under
Credit Default
Swaps(2)
Weighted
Average
Years to
Maturity(3)
2009 2008
December 31,
(In millions)
Aaa/Aa/A
Single name credit default swaps (corporate) . . . $ 5 $ 175 4.3 $ 1 $ 143 5.0
Credit default swaps referencing indices . . . . . . 46 2,676 3.4 (33) 1,372 4.1
Subtotal........................... 51 2,851 3.5 (32) 1,515 4.2
Baa
Single name credit default swaps (corporate) . . . 2 195 4.8 2 110 2.6
Credit default swaps referencing indices . . . . . . — 10 5.0 (5) 215 4.1
Subtotal........................... 2 205 4.8 (3) 325 3.6
Ba
Single name credit default swaps (corporate) . . . — 25 5.0 — 25 1.6
Credit default swaps referencing indices . . . . . . — — — — — —
Subtotal........................... — 25 5.0 — 25 1.6
B
Single name credit default swaps (corporate) . . . — — — — — —
Credit default swaps referencing indices . . . . . . — 20 5.0 (2) 10 5.0
Subtotal........................... — 20 5.0 (2) 10 5.0
Caa and lower
Single name credit default swaps (corporate) . . . — — — — — —
Credit default swaps referencing indices . . . . . . — — — — — —
Subtotal........................... — — — — — —
In or near default
Single name credit default swaps (corporate) . . . — — — — — —
Credit default swaps referencing indices . . . . . . — — — — — —
Subtotal........................... — — — — — —
Total ............................. $53 $3,101 3.6 $(37) $1,875 4.0
(1) The rating agency designations are based on availability and the midpoint of the applicable ratings among Moody’s, S&P and Fitch. If no
rating is available from a rating agency, then the MetLife rating is used.
(2) Assumes the value of the referenced credit obligations is zero.
(3) The weighted average years to maturity of the credit default swaps is calculated based on weighted average notional amounts.
F-59MetLife, Inc.
MetLife, Inc.
Notes to the Consolidated Financial Statements — (Continued)