MetLife 2009 Annual Report Download - page 114
Download and view the complete annual report
Please find page 114 of the 2009 MetLife annual report below. You can navigate through the pages in the report by either clicking on the pages listed below, or by using the keyword search tool below to find specific information within the annual report.-
 1
1 -
2
-
3
-
4
-
5
-
6
-
7
-
8
-
9
-
10
-
11
-
12
-
13
-
14
-
15
-
16
-
17
-
18
-
19
-
20
-
21
-
22
-
23
-
24
-
25
-
26
-
27
-
28
-
29
-
30
-
31
-
32
-
33
-
34
-
35
-
36
-
37
-
38
-
39
-
40
-
41
-
42
-
43
-
44
-
45
-
46
-
47
-
48
-
49
-
50
-
51
-
52
-
53
-
54
-
55
-
56
-
57
-
58
-
59
-
60
-
61
-
62
-
63
-
64
-
65
-
66
-
67
-
68
-
69
-
70
-
71
-
72
-
73
-
74
-
75
-
76
-
77
-
78
-
79
-
80
-
81
-
82
-
83
-
84
-
85
-
86
-
87
-
88
-
89
-
90
-
91
-
92
-
93
-
94
-
95
-
96
-
97
-
98
-
99
-
100
-
101
-
102
-
103
-
 104
104 -
 105
105 -
 106
106 -
 107
107 -
 108
108 -
 109
109 -
 110
110 -
 111
111 -
 112
112 -
 113
113 -
 114
114 -
 115
115 -
 116
116 -
 117
117 -
 118
118 -
 119
119 -
 120
120 -
 121
121 -
 122
122 -
 123
123 -
 124
124 -
125
-
126
-
127
-
128
-
129
-
130
-
131
-
132
-
133
-
134
-
135
-
136
-
137
-
138
-
139
-
140
-
141
-
142
-
143
-
144
-
145
-
146
-
147
-
148
-
149
-
150
-
151
-
152
-
153
-
154
-
155
-
156
-
157
-
158
-
159
-
160
-
161
-
162
-
163
-
164
-
165
-
166
-
167
-
168
-
169
-
170
-
171
-
172
-
173
-
174
-
175
-
176
-
177
-
178
-
179
-
180
-
181
-
182
-
183
-
184
-
185
-
186
-
187
-
188
-
189
-
190
-
191
-
192
-
193
-
194
-
195
-
196
-
197
-
198
-
199
-
200
-
201
-
202
-
203
-
204
-
205
-
206
-
207
-
208
-
209
-
210
-
211
-
212
-
213
-
214
-
215
-
216
-
217
-
218
-
219
-
220
 |
 |

in U.S. Treasury, agency and government guaranteed fixed maturity securities, as well as securities of the Mexican government and certain
Mexican government agencies at estimated fair value were $25.4 billion and $21.3 billion; and $4.8 billion and $4.0 billion at December 31,
2009 and 2008, respectively.
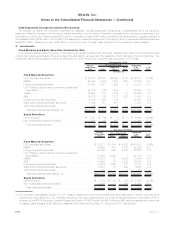
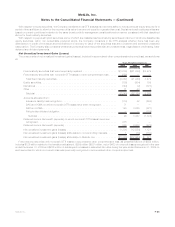
Concentrations of Credit Risk (Fixed Maturity Securities) — U.S. and Foreign Corporate Securities. The Company maintains a diversified
portfolio of corporate fixed maturity securities across industries and issuers. This portfolio does not have an exposure to any single issuer in
excess of 1% of total investments. The tables below present the major industry types that comprise the corporate fixed maturity securities
holdings, the largest exposure to a single issuer and the combined holdings in the ten issuers to which it had the largest exposure at:
Estimated
Fair
Value %of
Total
Estimated
Fair
Value %of
Total
2009 2008
December 31,
(In millions)
Corporate fixed maturity securities — by industry type:
Foreign(1) ........................................... $ 38,030 34.5% $29,679 32.0%
Industrial ............................................ 17,246 15.6 13,324 14.3
Consumer ........................................... 16,924 15.4 13,122 14.1
Utility .............................................. 14,785 13.4 12,434 13.4
Finance............................................. 13,756 12.5 14,996 16.1
Communications....................................... 6,580 6.0 5,714 6.1
Other .............................................. 2,896 2.6 3,713 4.0
Total. . . . . . . . . . . . . . . . . . . . . . . . . . . . . . . . . . . . . . . . . . . . . . $110,217 100.0% $92,982 100.0%
(1) Includes U.S. Dollar-denominated debt obligations of foreign obligors and other foreign fixed maturity security investments.
Estimated
Fair
Value %ofTotal
Investments
Estimated
Fair
Value %ofTotal
Investments
2009 2008
December 31,
(In millions)
Concentrations within corporate fixed maturity securities:
Largestexposuretoasingleissuer ..................... $1,038 0.3% $1,469 0.5%
Holdings in ten issuers with the largest exposures . . . . . . . . . . . . $7,506 2.3% $8,446 2.8%
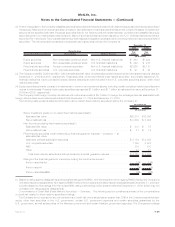
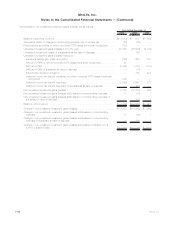
Concentrations of Credit Risk (Fixed Maturity Securities) — RMBS. The table below presents the Company’s RMBS holdings and
portion rated Aaa/AAA and portion rated NAIC 1 at:
Estimated
Fair
Value %of
Total
Estimated
Fair
Value %of
Total
2009 2008
December 31,
(In millions)
By security type:
Collateralizedmortgageobligations...................................... $24,480 55.6% $26,025 72.2%
Pass-throughsecurities ............................................. 19,540 44.4 10,003 27.8
Total RMBS . . . . . . . . . . . . . . . . . . . . . . . . . . . . . . . . . . . . . . . . . . . . . . . . . . . . $44,020 100.0% $36,028 100.0%
By risk profile:
Agency........................................................ $33,334 75.7% $24,409 67.8%
Prime ......................................................... 6,775 15.4 8,254 22.9
Alternativeresidentialmortgageloans .................................... 3,911 8.9 3,365 9.3
Total RMBS . . . . . . . . . . . . . . . . . . . . . . . . . . . . . . . . . . . . . . . . . . . . . . . . . . . . $44,020 100.0% $36,028 100.0%
PortionratedAaa/AAA(1).............................................. $35,626 80.9% $33,265 92.3%
PortionratedNAIC1(2) ............................................... $38,464 87.4% $34,513 95.8%
(1) Based on rating agency designations, without adjustment for the revised National Association of Insurance Commissioners (“NAIC”)
methodology which became effective December 31, 2009.
(2) Based on rating agency designations and equivalent ratings of the NAIC, with the exception of non-agency RMBS held by the Company’s
domestic insurance subsidiaries. Non-agency RMBS held by the Company’s domestic insurance subsidiaries at December 31, 2009 are
F-30 MetLife, Inc.
MetLife, Inc.
Notes to the Consolidated Financial Statements — (Continued)