MetLife 2009 Annual Report Download - page 145
Download and view the complete annual report
Please find page 145 of the 2009 MetLife annual report below. You can navigate through the pages in the report by either clicking on the pages listed below, or by using the keyword search tool below to find specific information within the annual report.-
 1
1 -
2
-
3
-
4
-
5
-
6
-
7
-
8
-
9
-
10
-
11
-
12
-
13
-
14
-
15
-
16
-
17
-
18
-
19
-
20
-
21
-
22
-
23
-
24
-
25
-
26
-
27
-
28
-
29
-
30
-
31
-
32
-
33
-
34
-
35
-
36
-
37
-
38
-
39
-
40
-
41
-
42
-
43
-
44
-
45
-
46
-
47
-
48
-
49
-
50
-
51
-
52
-
53
-
54
-
55
-
56
-
57
-
58
-
59
-
60
-
61
-
62
-
63
-
64
-
65
-
66
-
67
-
68
-
69
-
70
-
71
-
72
-
73
-
74
-
75
-
76
-
77
-
78
-
79
-
80
-
81
-
82
-
83
-
84
-
85
-
86
-
87
-
88
-
89
-
90
-
91
-
92
-
93
-
94
-
95
-
96
-
97
-
98
-
99
-
100
-
101
-
102
-
103
-
104
-
105
-
106
-
107
-
108
-
109
-
110
-
111
-
112
-
113
-
114
-
115
-
116
-
117
-
118
-
119
-
120
-
121
-
122
-
123
-
124
-
125
-
126
-
127
-
128
-
129
-
130
-
131
-
132
-
133
-
134
-
 135
135 -
 136
136 -
 137
137 -
 138
138 -
 139
139 -
 140
140 -
 141
141 -
 142
142 -
 143
143 -
 144
144 -
 145
145 -
 146
146 -
 147
147 -
 148
148 -
 149
149 -
 150
150 -
 151
151 -
 152
152 -
 153
153 -
 154
154 -
 155
155 -
156
-
157
-
158
-
159
-
160
-
161
-
162
-
163
-
164
-
165
-
166
-
167
-
168
-
169
-
170
-
171
-
172
-
173
-
174
-
175
-
176
-
177
-
178
-
179
-
180
-
181
-
182
-
183
-
184
-
185
-
186
-
187
-
188
-
189
-
190
-
191
-
192
-
193
-
194
-
195
-
196
-
197
-
198
-
199
-
200
-
201
-
202
-
203
-
204
-
205
-
206
-
207
-
208
-
209
-
210
-
211
-
212
-
213
-
214
-
215
-
216
-
217
-
218
-
219
-
220
 |
 |

securities. The counterparties are permitted by contract to sell or repledge this collateral. At December 31, 2009 and 2008, the Company
provided cash collateral for exchange-traded futures of $562 million and $686 million, respectively, which is included in premiums and other
receivables.
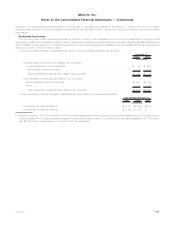
Embedded Derivatives
The Company has certain embedded derivatives that are required to be separated from their host contracts and accounted for as
derivatives. These host contracts principally include: variable annuities with guaranteed minimum benefits, including GMWBs, GMABs and
certain GMIBs; ceded reinsurance contracts of guaranteed minimum benefits related to GMABs and certain GMIBs; and funding agreements
with equity or bond indexed crediting rates.
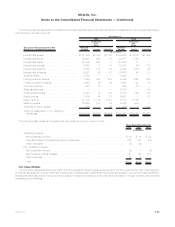
The following table presents the estimated fair value of the Company’s embedded derivatives at:
2009 2008
December 31,
(In millions)
Net embedded derivatives within asset host contracts:
Cededguaranteedminimumbenefits......................................... $ 76 $ 205
Calloptionsinequitysecurities ............................................ (37) (173)
Netembeddedderivativeswithinassethostcontracts............................ $ 39 $ 32
Net embedded derivatives within liability host contracts:
Directguaranteedminimumbenefits......................................... $1,500 $3,134
Other............................................................. 5 (83)
Netembeddedderivativeswithinliabilityhostcontracts ........................... $1,505 $3,051
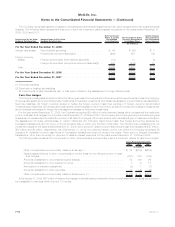
The following table presents changes in estimated fair value related to embedded derivatives:
2009 2008 2007
Years Ended December 31,
(In millions)
Net investment gains (losses)(1) . . . . . . . . . . . . . . . . . . . . . . . . . . . . . . . . . . . . . . . $1,758 $(2,650) $(321)
Policyholderbenefitsandclaims....................................... $ (114) $ 182 $ —
(1) Effective January 1, 2008, the valuation of the Company’s guaranteed minimum benefits includes an adjustment for the Company’s own
credit. Included in net investment gains (losses) for the years ended December 31, 2009 and 2008 were gains (losses) of ($1,932) million
and $2,994 million, respectively, in connection with this adjustment.
F-61MetLife, Inc.
MetLife, Inc.
Notes to the Consolidated Financial Statements — (Continued)